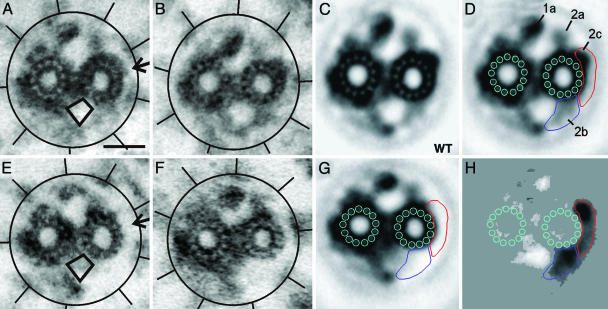
Fig. 4.
Localization of Klp1 by electron microscopy. The central pair complex and surrounding radial spokes of wild-type axonemes (A and B) and AC30 axonemes (E and F) show the loss of one density (arrow in A) and the displacement of density into the region indicated by a rhomboid. Circles and lines highlight the location of radial spokes in each image. Normalized image averages of wild-type (C) and AC30 (G) central pair complexes provide greater detail but blur the displaced images of density C2b. The wild-type average from C is repeated in D with the addition of density labels and outlines that aid in alignment of the images in C, G, and H. A difference image (H) shows density changes between wild-type and knockdown averages significant at the 0.005% level and reveals the shape of the regions of reduced density caused by loss of Klp1 (darker areas) as well as regions of increased density (lighter areas). Darker regions in H are outlined as areas related to density 2b (blue) and 2c (red), and the same outlines are shown in D and G. Increased density related to C1 projection 1a is caused by a rotational shift in the relative orientation of C1 and C2 microtubules (see Movie 1). (Scale bar, 20 nm.)

