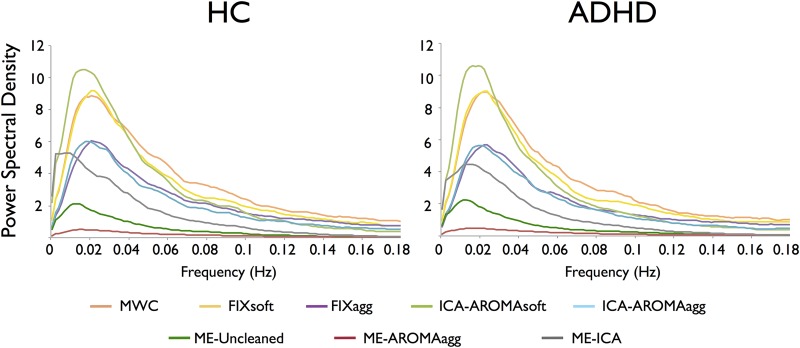
Fig 4. Power spectral density plotted for every data cleaning strategy, per dataset.
ICA-AROMAsoft, MWC and FIXsoft showed the highest power spectral density amplitudes. MWC and FIXsoft also showed residual power in the non-BOLD frequencies. FIXagg and ICA-AROMAagg exhibited a power spectral density reduction at high frequencies and a drop of the very low frequencies. ME-ICA cleanup efficiently reduced the power spectral density variability, suppressed the high frequencies and preserved the ultra-slow frequencies. ME-Uncleaned and ME-AROMAagg power spectral densities were very flattened at low and high frequencies.

