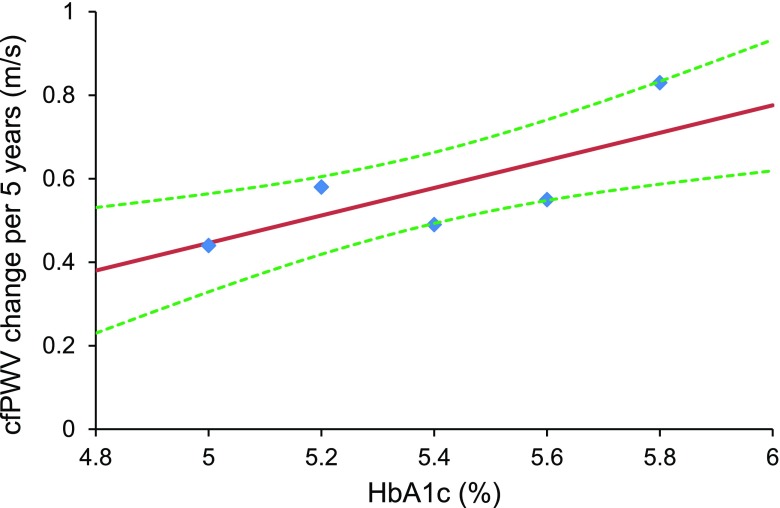
Figure 1.
The association between HbA1c and change in cfPWV. Plotted points show the cfPWV change per 5 years for each quintile of HbA1c, plotted at the median of each quintile. The solid line shows the linear association, and the dashed lines show the 95% CI. Values shown are adjusted to white men without diabetes at age 65 with a MAP of 90 mmHg. Test for quadratic (nonlinear) effect gave a P value = 0.48.

