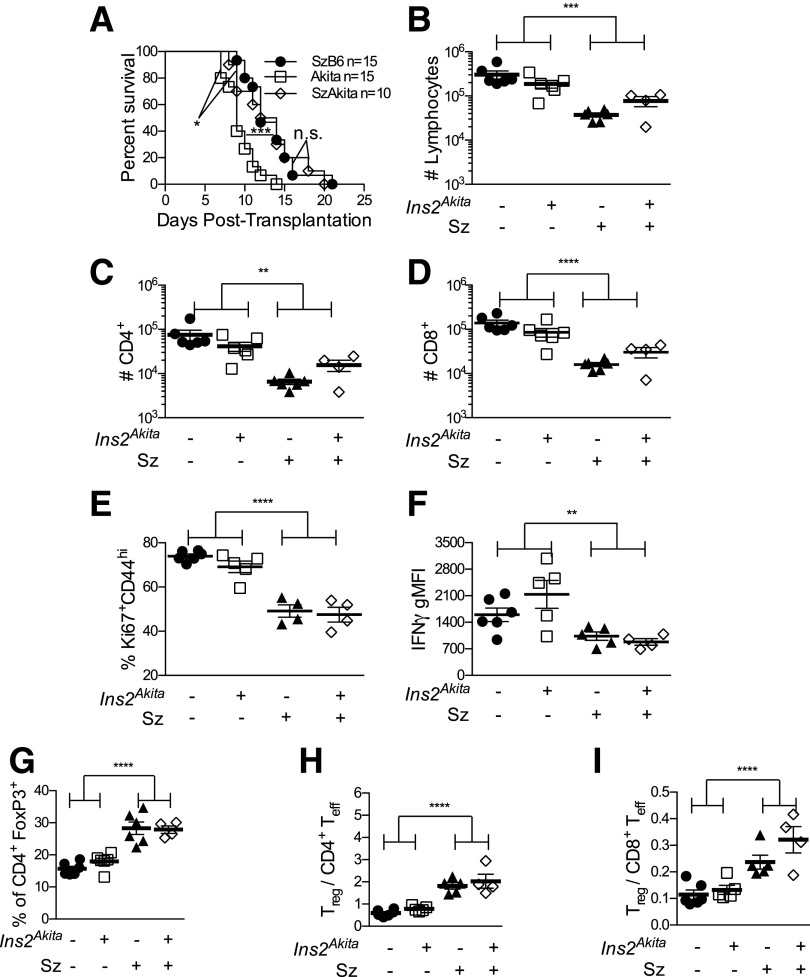
Figure 3.
No impact of chronic hyperglycemia on cellular responses to islet allografts. A: Survival curves of islet allograft acute rejection. n = 10–15. ***P < 0.001, Akita vs. SzB6; *P < 0.05, Akita vs. SzAkita; SzB6 vs. SzAkita not significant by nonparametric Mann-Whitney U test. B: Total numbers of graft-infiltrating cells at day 7. Numbers of CD4+ (C) and CD8+ T cells (D) within CD90+ graft-infiltrating cells. E: Frequency of responding Ki67+CD44hi cells within CD90+CD8+ graft-infiltrating cells. F: Geometric mean fluorescence intensity (gMFI) of IFNγ in CD90+CD8+FoxP3−Ki67+CD44hi T cells. G: Frequency of FoxP3+ cells within CD90+CD4+ graft-infiltrating cells. Ratio of CD90+CD4+FoxP3+ regulatory T cells to CD90+FoxP3−Ki67+CD44hi CD4+ (H) and CD8+ (I) effector T cells. Black circles, B6; white squares, Akita; black triangles, SzB6; white diamonds, SzAkita. In B–I, n = 4–6 per group from five independent experiments. Two-way ANOVA with Bonferroni corrections: **P < 0.01; ***P < 0.001; ****P < 0.0001.

