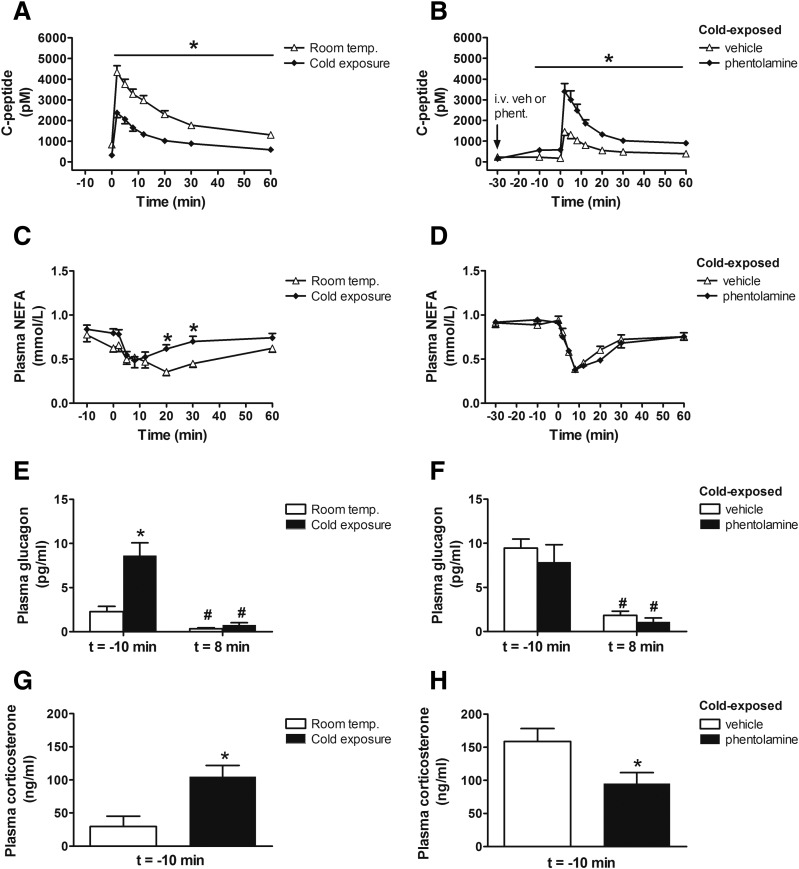
Figure 6.
Effect of cold exposure and the SNS on insulin clearance and hormonal measures. Plasma C-peptide (A and B), plasma NEFA (C and D), plasma glucagon before (t = −10 min) and after (t = 8 min) i.v. glucose bolus (E and F), and plasma corticosterone levels before (t = −10 min) i.v. glucose bolus (G and H) in fasted adult male Wistar rats 1) exposed at room temperature (22°C) or the cold (4°C) for 28 h or 2) to the cold at 4°C for 28 h and given a continuous i.v. infusion of phentolamine (8 μg/kg/min) or vehicle, beginning 30 min before and continuing throughout a FSIGT. Mean ± SEM. *P < 0.05 vs. room temperature (left panels), *P < 0.05 vs. vehicle (right panels); #P < 0.05 vs. t = −10 min.

