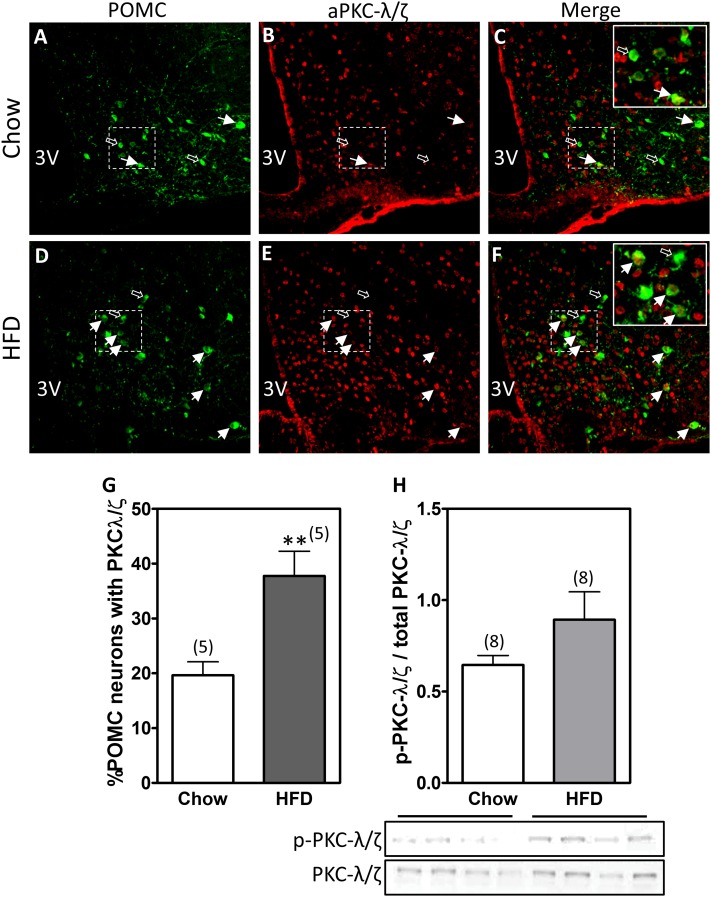
Figure 2.
aPKC expression increases within POMC neurons in HFD-fed mice. PKC-λ/ζ was detected via immunofluorescence in hypothalamic sections from Pomc-tau-Gfp mice fed chow or an HFD for 4 months. A and D: Representative unstained images showing green fluorescent protein (GFP) expression in POMC neurons from mice fed chow (A) or an HFD (D). B and E: The same sections from A and D were incubated with an antibody that recognizes both the λ and ζ PKC isoforms. C and F: Merged images revealing POMC neurons that express PKC-λ/ζ (yellow cells). White arrows indicate double-positive cells, whereas black arrows demonstrate PKC-λ/ζ-negative POMC neurons. G: Double-positive cells (GFP and PKC-λ/ζ) were quantified in a total of four brain sections from five animals in each group. Bars represent the mean percentage ± SEM of POMC cells expressing PKC-λ/ζ. H: Immunoblot of phosphorylated aPKC (p-PKC-λ/ζ) and total aPKC (PKC-λ/ζ) in hypothalamic homogenates. Bars represent the ratio of mean pixel densities ± SEM between p-PKC-λ/ζ and total PKC-λ/ζ bands quantified from eight samples per group. **P < 0.01.

