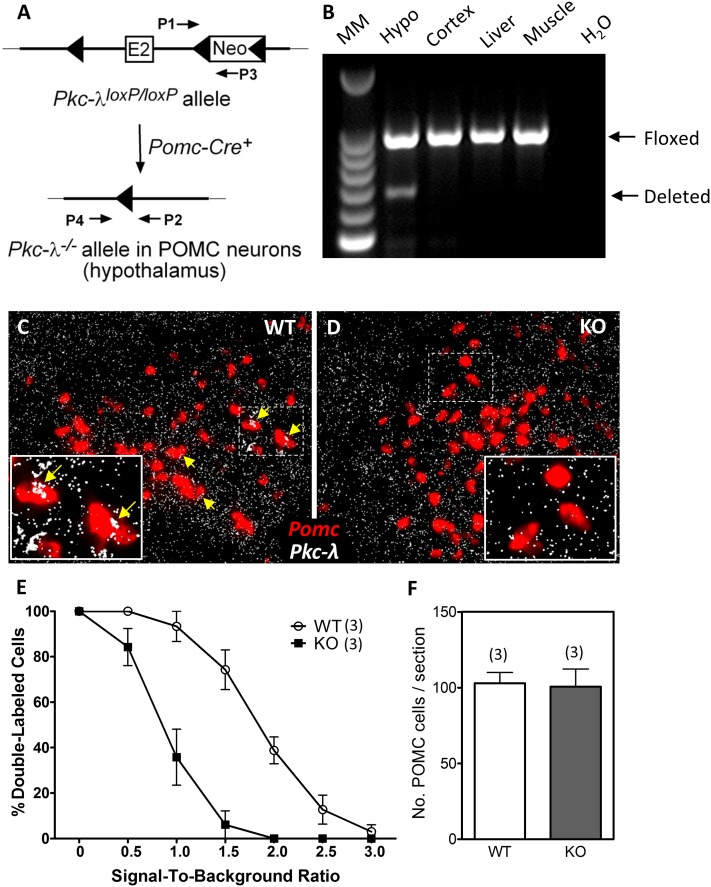
Figure 3.
Validation of mice lacking the Pkc-λ gene in POMC neurons. A: Schematic of the genomic DNA region around exon 2 of Pkc-λ in mice carrying a targeted Pkc-λ allele (Pkc-λloxP/loxP). The PCR primers P1 and P3 amplify an intronic region located downstream of Pkc-λ exon 2 (E2) that contains a loxP-flanked Neo cassette insert. After Cre-mediated excision of exon 2 and the Neo cassette, a PCR amplification product identifying the deleted Pkc-λ allele (Pkc-λ−/−) becomes detectable using primers P2 and P4. B: PCR amplification products from genomic DNA using primers P1–P3 (Floxed) and P2–P4 (Deleted). Tissues were dissected from a POMC-λKO mouse. Lanes represent (from left to right) a 100-bp DNA molecular marker (MM) ladder, hypothalamus (Hypo; positive for recombination), cortex, liver, muscle, H2O control. C and D: In situ hybridization on brain sections from WT (C) and POMC-λKO (D) animals using probes against Pomc (red) and Pkc-λ (white) mRNA. The dashed rectangles denote regions corresponding to magnified insets. Yellow arrows indicate POMC neurons that express Pkc-λ. E: Percentage of cells coexpressing Pomc and Pkc-λ mRNA as a function of SBR. The ordinate value represents the percentage of cells having an SBR greater than the value of the abscissa. Data are mean ± SEM from three animals per group. F: Quantification of arcuate POMC neurons in WT and POMC-λKO mice. Positive cells quantified on six sections from three animals per group. Bars represent the mean ± SEM.

