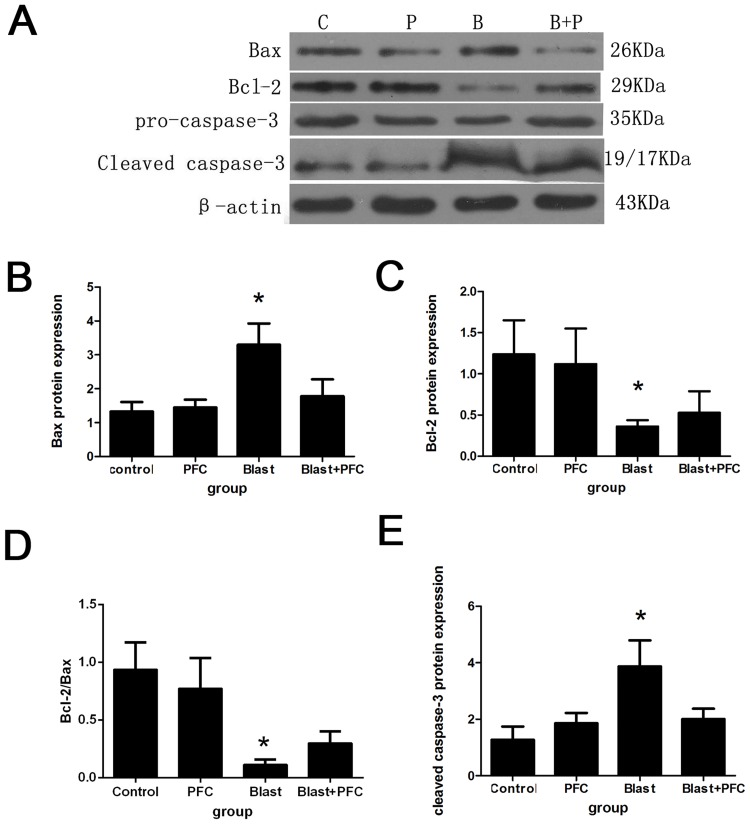
Fig 4. Effect of PFC on Bax, Bcl-2, and cleaved caspase-3 expression in A549 cells.
(A) Western blot analysis was used on the protein lysates purified from A549 cells in different groups. β-actin was used as a control. (B) Densitometric analysis of Bax protein. (C) Densitometric analysis of Bcl-2 protein. (D) Analysis of the Bcl-2/Bax ratio. (E) Densitometric analysis of cleaved caspase-3 protein. * p<0.05 compared to the Control group, * p<0.05 compared to the Blast+PFC group.

