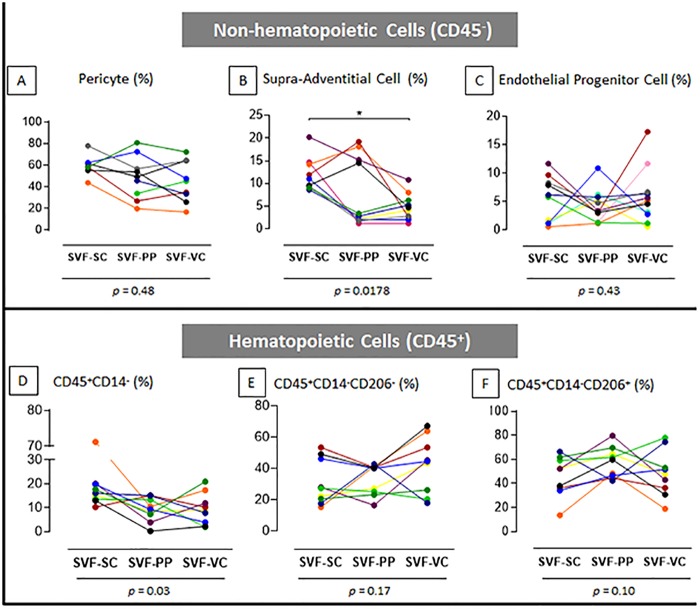
Fig 2. SVF contents of subcutaneous, preperitoneal and visceral adipose tissues from morbidly obese patients.
The quantitative data of the flow cytometry analysis shows the distribution of the non-hematopoietic (A, B, C) and hematopoietic (D, E, F) cell subpopulations. The percentage of each subpopulation analyzed from each patient is expressed. Values obtained from different cell samples harvested from the same patient are connected with lines. p values under graphs resulted from statistical tests. Asterisk represents the p value from the post-test of statistical analyses: (*) p <0.05. n = 9 to 11, according to the population. SVF: stromal vascular fraction; SC: Subcutaneous; PP: preperitoneal; VC: visceral; AT: adipose tissue.

