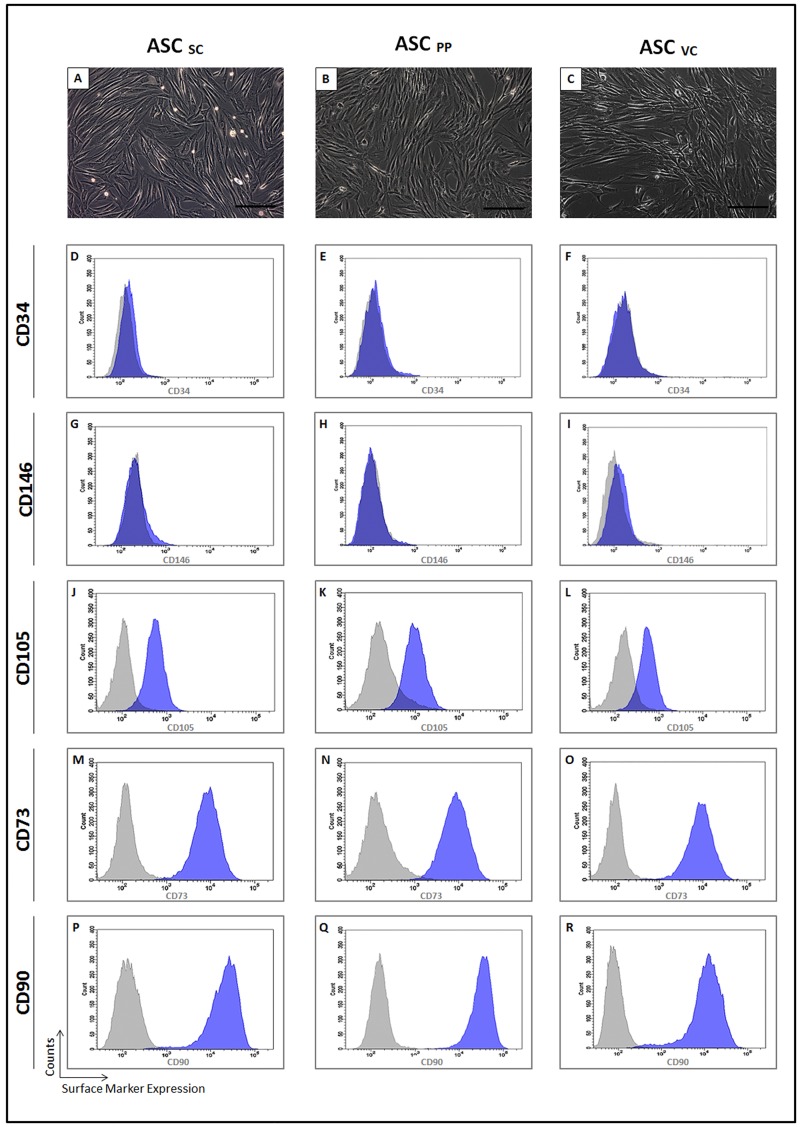
Fig 3. Morpho-phenotypical characterization of ASC from the subcutaneous, preperitoneal and visceral adipose tissues of morbid obese patients.
ASC from the subcutaneous (A), preperitoneal (B) and visceral (C) showed fibroblastic cells. (A, B, C) phase contrast. Bar size: 100 micrometers. The histograms show the ASC surface expression of CD34 (D-F), CD146 (G-I); CD105 (J-L); CD73 (M-O) and CD90 (P-R). The histograms of the ASC from the subcutaneous (D, G, J, M, P), preperitoneal (E, H, K, N, Q) and visceral (F, I, L, O, R) depots are representative of independent experiments (n = 3). Gray histogram—negative control; blue histogram—expression of the indicated CD. ASC: adipose stem cell; SC: Subcutaneous; PP: preperitoneal; VC: visceral; CD: cluster of differentiation.

