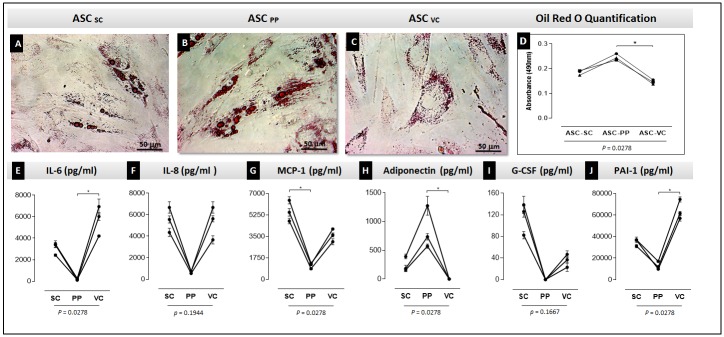
Fig 5. Differential lipid accumulation capacity and cytokine secretion of induced ASC derived from subcutaneous, preperitoneal and visceral depots.
The ASC were cultured under lipid accumulation stimulus for up to 3 weeks. Lipid accumulation was analyzed by Oil Red O staining (A-C). The total Oil Red O dye captured was measured in a spectrophotometer. The Graph (D) shows the quantitative results of the Oil Red O staining. ANOVA tests comparing the absorbance were performed. Cytokine secretion in the supernatant of the induced cells is expressed in graphs (E) IL-6, (F) IL-8, (G) MCP-1, (H) adiponectin, (I) G-CSF, (J) PAI-1. p values under graphs resulted from statistical tests. The asterisks represent the p values from the statistical post-tests: (*) p <0.05. (A-C) Optical microscopy—bar size: 50 micrometers. Assays were performed in triplicates for each of the 3 patients evaluated. ASC: adipose stem cell; SC: subcutaneous; PP: preperitoneal; VC: visceral; IL: interleukin; MCP-1: Monocyte Chemoattractant Protein 1; G-CSF: Granulocyte colony-stimulating factor; PAI-1: Plasminogen activator inhibitor-1.

