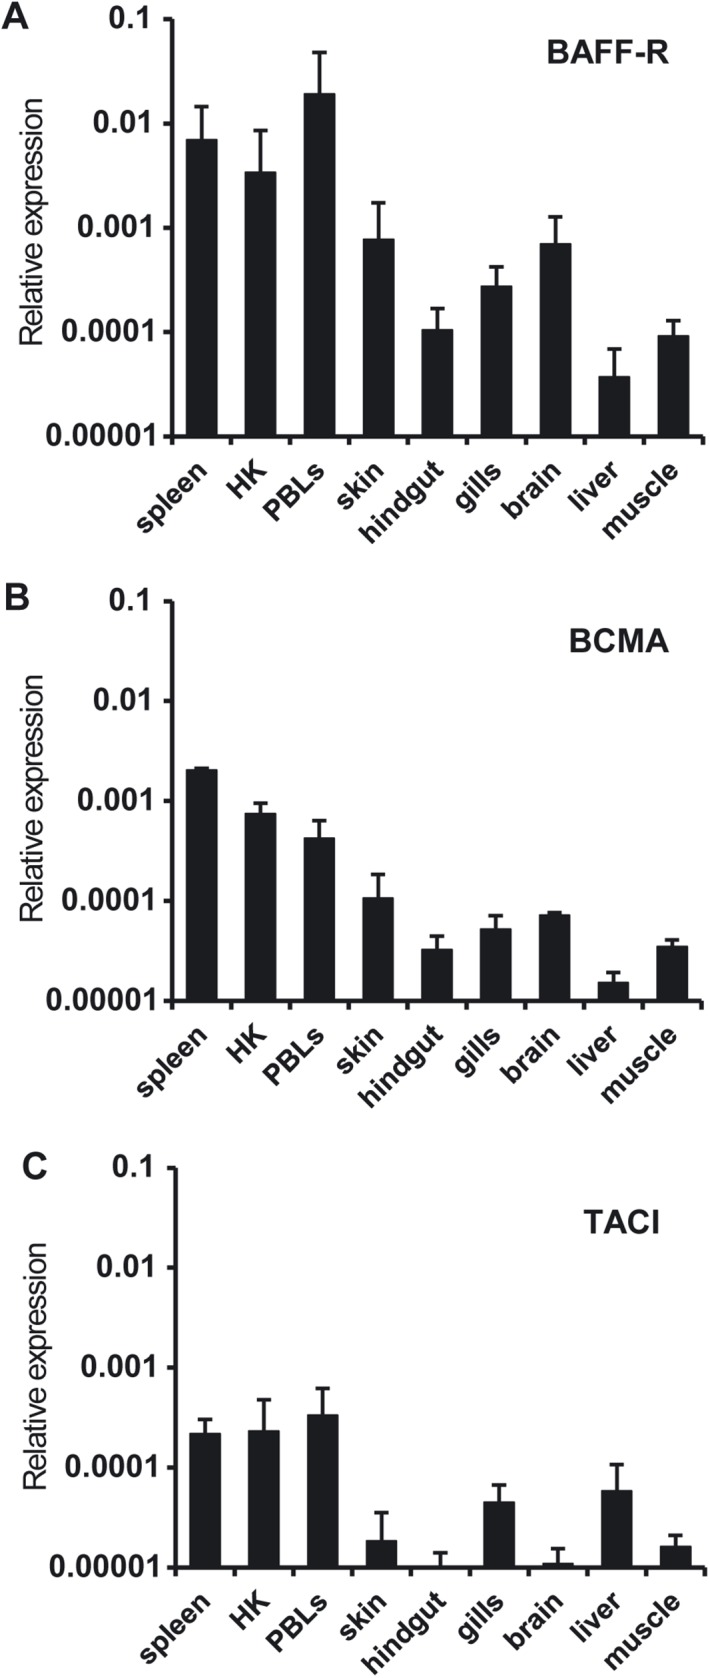
Fig 5. Constitutive levels of transcription of BAFF-R, BCMA and TACI in different tissues.

The amount of BAFF-R (A), BCMA (B) and TACI (C) mRNA in PBLs and tissues (spleen, head kidney (HK), skin, hindgut, gills, brain, liver and muscle) from 3 naïve perfused fish was estimated by real time PCR in duplicate samples. Data are shown as the gene expression relative to the expression of endogenous control EF-1α (mean + SD).
