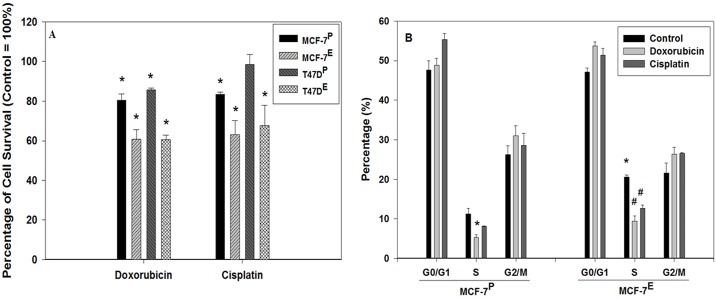
Fig 1. Enhanced sensitives to chemotherapeutic drugs doxorubicin and cisplatin in estrogen exposed MCF-7 and T47D cells as detected by MTT assay (A), and cell cycle analysis of estrogen exposed MCF-7 cells (B).
(A) MTT assay was performed with doxorubicin and cisplatin treated cells as described in materials and methods section. MTT data was converted into percentage with control as 100% and histogram was plotted. Statistically significant change in the cell growth of doxorubicin and cisplatin treated groups as compared to their respective untreated control is indicated by an * symbol. (B) Histograms representing percentage of doxorubicin and cisplatin treated cells as well as their respective untreated control cells in G0/G1, S, and G2/M compartments of cell cycle. The error bars represent standard error of the mean (±SEM). Statistically significant (p<0.05) changes are indicated by the symbols * and #. The symbol * represents statistically significant (p<0.05) changes in S phase population from doxorubicin treated MCF-7P (left panel) and untreated control MCF-7E cells (right panel) as compared to the untreated control MCF-7P cells. The symbol # indicates statistically significant changes in S phase population of MCF-7E cells after doxorubicin and cisplatin treatments as compared to the untreated MCF-7E cells.

