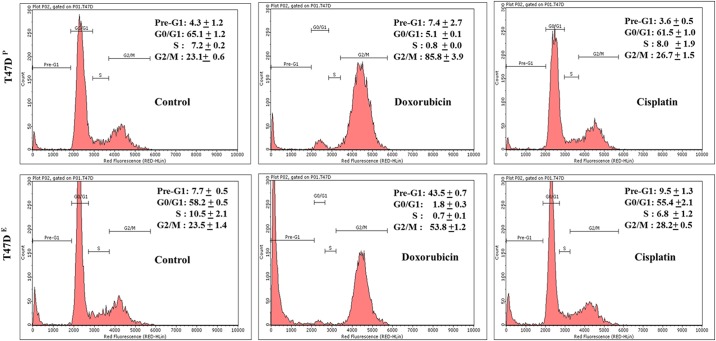
Fig 2. Flow cytometry analysis of cell cycle.
Representative flow cytometry histograms of percentage of cells in Pre-G1 (apoptotic cells), G0/G1, S and G2/M phases of cell cycle from T47DP cells (upper panel) and T47DE cells (lower panel) cells treated with doxorubicin and cisplatin or untreated control for 72 hrs. Control and treated cells were fixed, stained, and analyzed by flow cytometry as described in materials and methods.

