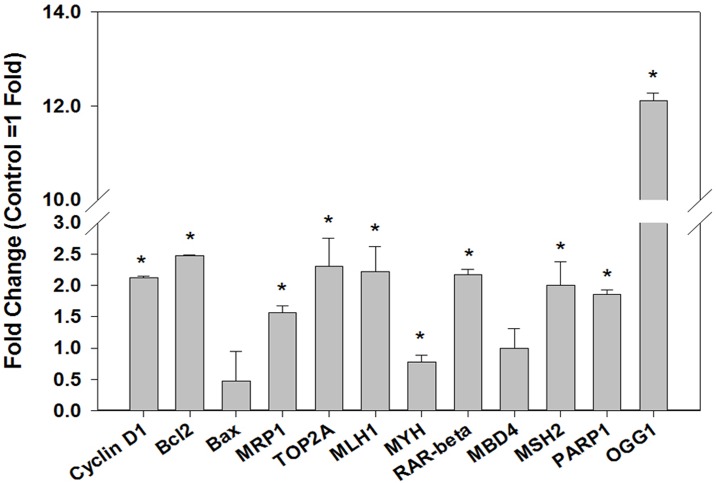
Fig 3. Real time quantitative reverse transcription PCR analysis of the expression of genes related to cell proliferation or survival, DNA repair, and drug transporters in MCF-7E cells as compared to MCF-7P cells.
One-step real-time quantitative reverse transcription PCR for gene expression at transcript level was performed as described in materials and methods. The gene expression in fold-change was calculated by delta-delta Ct method. Histograms were plotted by using the average of triplicate values. The error bars represent standard error of the mean (±SEM). Statistically significant (p<0.05) changes are indicated by symbol *.

