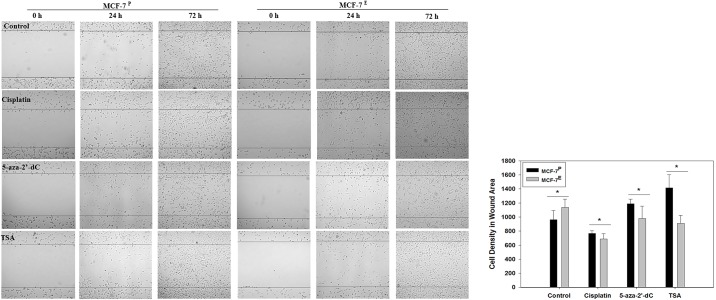
Fig 5. Representative photomicrographs (40 X) of wound healing assay (left panel) and histograms of density of cells migrated into wounded area (right panel) from MCF-7E and MCF-7P cells treated with cisplatin, 5 -aza-2’-dC, TSA and their respective untreated control cells.
In left panel, cells were seeded in dishes and wound healing assay was performed as described in materials and methods. Migration of cells into wounded area was observed under microscope at 0, 24, and 72 hrs. Density of cells migrated into wounded area at 72 hr was quantified by ImageJ software and the histogram was plotted using the data of cell density in the right panel. The cell density data is given in arbitrary units. The error bars represent standard error of the mean (±SEM). Statistically significant (p<0.05) changes between MCF-7E and MCF-7P cells within each treatment groups are indicated by symbol *.

