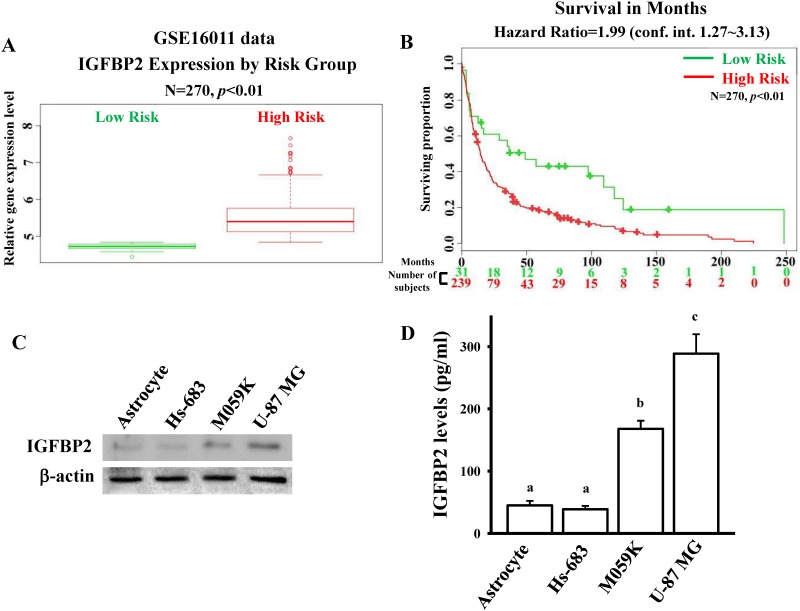
Fig 4. IGFBP2 is overexpressed in glioma.
(A) Relative IGFBP2 expression levels according to GBM patient risk group based on GSE16011 profiling. Higher risk patients had higher IGFBP2 expression, denoted by red symbols. Conversely, lower IGFBP2 expression was associated with higher survival, denoted in green. (B) Kaplan—Meier analysis of patient survival data from GSE16011 profiling. The x-axis values indicate the number of patients per group. The red curves indicate high-risk patients. The green curves indicate low-risk patients. The plus sign indicates censored observations. The p values were calculated using the log-rank test. Detection of endogenous IGFBP2 protein levels in normal human astrocytes and three glioma cell lines by using immunoblotting assays (C) and ELISA assays (D). Cells were grown overnight to 80% confluency in serum-containing media. The total lysates and conditioned media were respectively used to measure intracellular and extracellular IGFBP2 protein levels by immunoblotting assays and ELISA assays according to the manufacturer’s instructions in method section. Data are expressed as the mean ± SD of three independent experiments. After analyzing by one way ANOVA with Tukey—Kramer multiple comparison test, different letters above bars denote samples that were significantly different (p < 0.05) compared with astrocyte.

