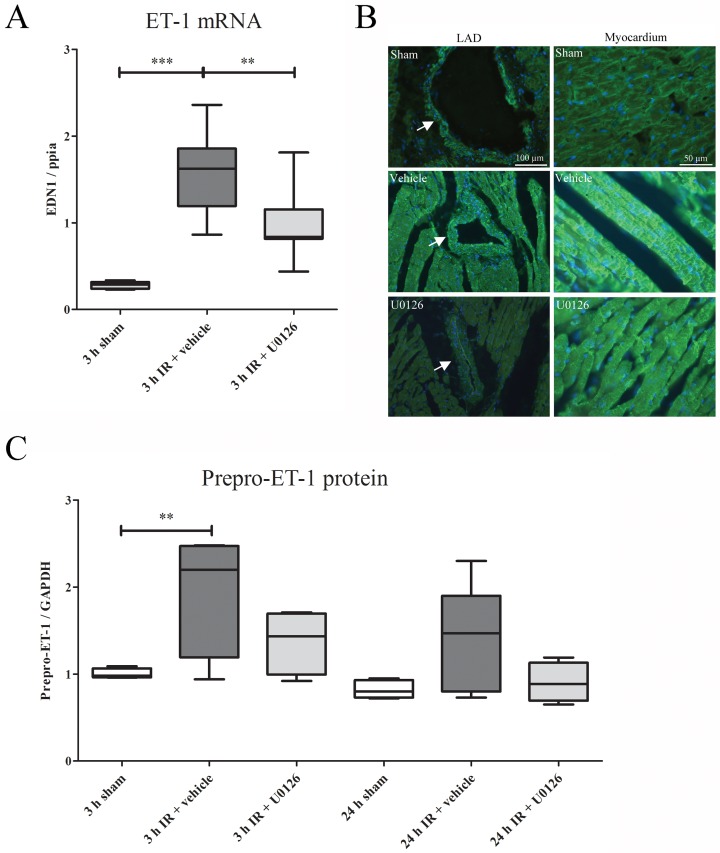
Fig 3.
(A) The mRNA expression levels of ET-1 were sigificantly upregulated at 3 h of IR. U0126 treatment decreased ET-1 mRNA levels significantly compared to vehicle treatment. Results are shown as whisker plots, with whiskers indicating SEM (n = 5–8), ** P ≤ 0.01, ***P ≤ 0.001, one-way ANOVA with Bonferroni’s multiple comparison test. B. Protein immunohistochemistry of LAD (left column, arrows) and myocardium (right column) revealed an increase of ET-1 expression in the vehicle treatment after 24 h of IR. This elavated expression was decreased after treatment with U0126 in both LAD and in the myocardium. (C) Western blot analysis revealed a significant increase in prepro-ET-1 protein levels (30 kDa) at 3 h of IR, and the same trend was observed at 24 h of IR. The results are shown as Whisker box plots, with bars and whiskers indicating mean values ± SEM (n = 4–5). ** P ≤ 0.01, one-way ANOVA with Bonferroni’s multiple comparison test.

