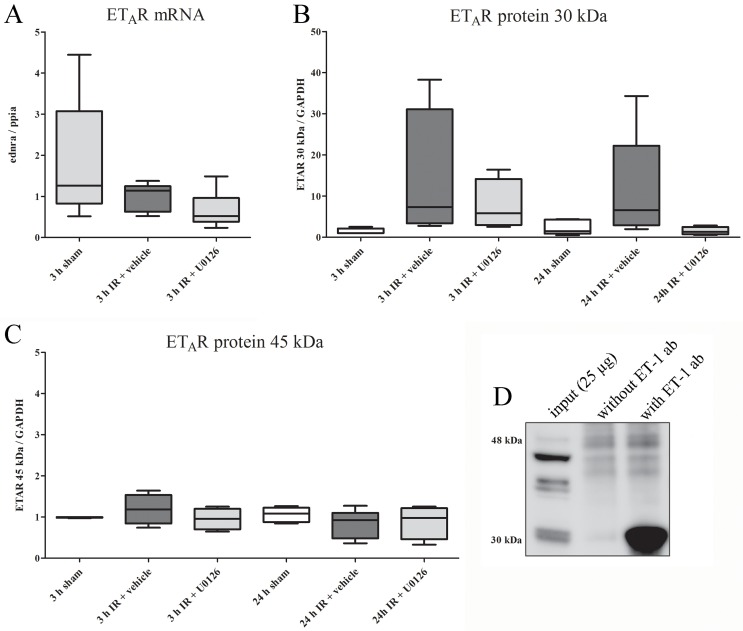
Fig 5.
(A) mRNA expression levels of ETAR in homogenates of the myocardium and left anterior descending artery (LAD) from sham, IR, or IR and U0126 treated rats at 3 h of reperfusion. No significant changes in ETAR mRNA expression were found between the sham, IR, and IR+U0126 groups (one-way ANOVA post-Bonferroni’s multiple comparison test). Results are expressed as whisker box plots (n = 5–8). (B) Two ETAR-like immunoreactive bands were observed. The upper (higher molecular weight) band, corresponding to full-length ETAR (45 kDa), did not show any changes in overall expression level regardless of treatment and reperfusion duration (one-way ANOVA post-Bonferroni’s multiple comparison test). Results are shown as Whisker boxplots, (n = 4–5). (C) The lower molecular-weight band (30 kDa), generally showed strong up-regulation at 3 h of reperfusion, and this was partly retained at 24 h. U0126 tended to reduce this increase, although this was not significant. Results are shown as Whiske box plots (n = 4–5). (D) A co-immunoprecipitation experiment used 25 μg total protein (3 h IR + vehicle) as input and 5 μg mouse mAb anti-ET-1 (Abcam, ab2786) as the immunoprecipitating antibody. Western blot analysis was performed to detect the ETAR using Sigma pAb rabbit-anti-ETAR #9780 1:500. Specific ETAR-like immunoreactivity was observed for the low molecular weight band (30 kDa).

