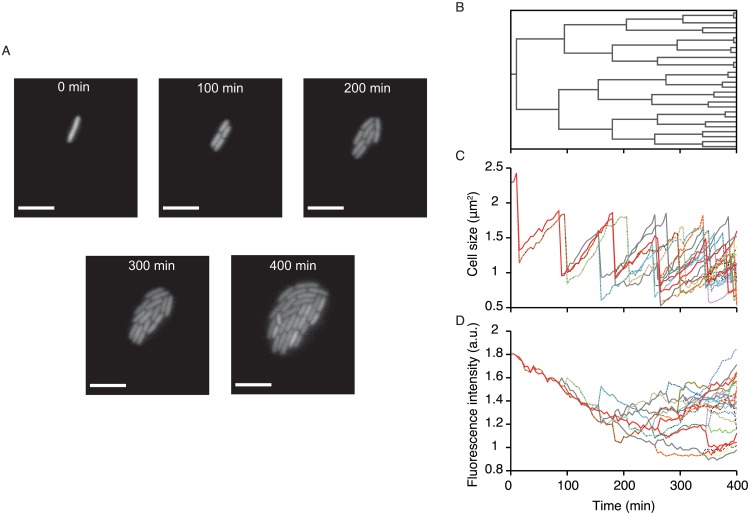
Fig 1. An example of cell lineage data obtained by single-cell time-lapse measurement.
A Time-lapse images of a growing microcolony of E. coli F3/pTN001. This strain expresses a fluorescent protein, Venus-YFP, from a low copy plasmid (see Materials and Methods). One can obtain the time-lapse images for many microcolonies (ca. 100) starting from different ancestral cells in a single experiment. Scale bars, 5 μm. B Cell lineage tree for the microcolony in (A), which shows the genealogical relationship of individual cells. C Transitions of cell sizes. Different lines correspond to different single-cell lineages on the tree (B). Due to the fluctuation of growth parameters such as elongation rate and division interval, the transition patterns are variable among the cell lineages. D Transitions of mean fluorescence intensity along single-cell lineages on the tree (B). Again, the transition patterns are variable among the cell lineages.

