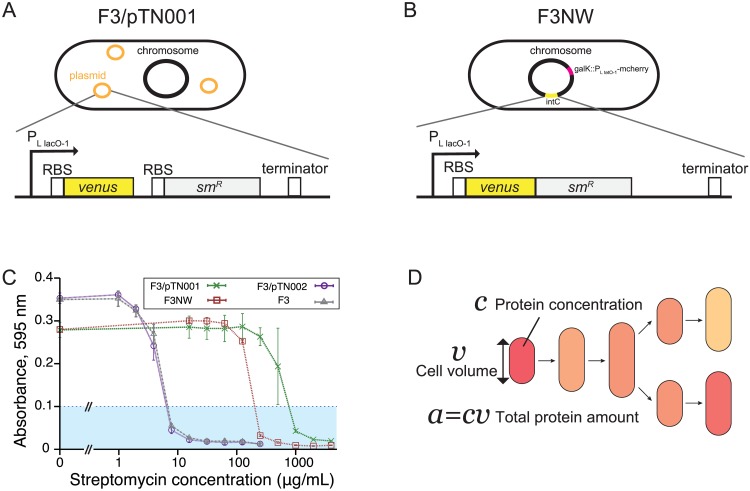
Fig 5. E. coli strains used in single-cell time-lapse measurements.
A. F3/pTN001 strain. This strain expresses a fluorescent protein Venus-YFP and streptomycin resistance-conferring protein SmR under the control of the PLlacO-1 promoter from a low copy plasmid pTN001 (pSC101 ori). Ribosomal binding sites are present in front of the start codons of both structural genes, thus proteins are translated separately. We analyzed the data assuming that production rate and protein amount of SmR are strongly correlated with those of Venus-YFP. B. F3NW strain. This strain expresses a fusion protein Venus-SmR under the control of the PLlacO-1 promoter from intC locus on the chromosome. To facilitate the image analysis, we additionally integrated an mcherry-rfp gene that is expressed under the control of the PLtetO-1 promoter [33] from galK locus on the chromosome. C. MICs of streptomycin for F3, F3/pTN001, F3/pTN002, and F3NW. Absorbance at 595 nm of cell cultures of each strain at different concentrations of streptomycin was measured after 20-hour incubation with shaking at 37°C. pTN002 is a negative control plasmid in which the smR gene was removed from pTN001. The average of three replicates are plotted with the standard deviation for each condition of streptomycin concentration. We determined MICs by the minimum concentration above which the absorbance of cell culture remains below 0.1 (cyan region): 8 μg/mL for F3 (gray) and F3/pTN002 (purple), 250 μg/mL for F3NW (brown), and 1000 μg/mL for F3/pTN001 (green). D. Quantities obtained from time-lapse images. We extracted the time-series of cell volume v, protein concentration (mean fluorescence intensity per cell area) c, and total protein amount (sum of fluorescence intensity of the pixels within a cell) a = cv together with cell lineage trees, and calculated , , and for each cell lineage according to the definitions in Eqs 15–17.

