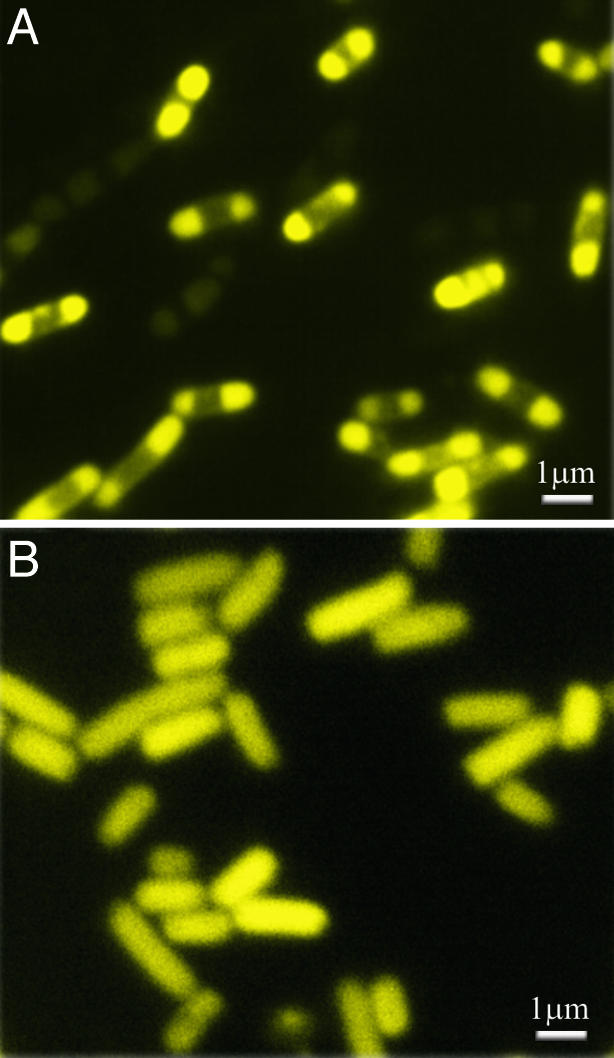
Fig. 4.

Fluorescence micrographs of BL21-DE3-ΔE1 cells containing either plasmid pRSETB-Y-EI (A) or pRSETB-Y-EI H189Q (B) in LB broth. The samples were taken 2 h after the addition of 0.5 mM IPTG. Virtually all cells expressing Y-EI (A) exhibited a polar distribution of the fluorescence, whereas all cells that expressed the H189Q mutant (B) displayed a diffuse distribution.
