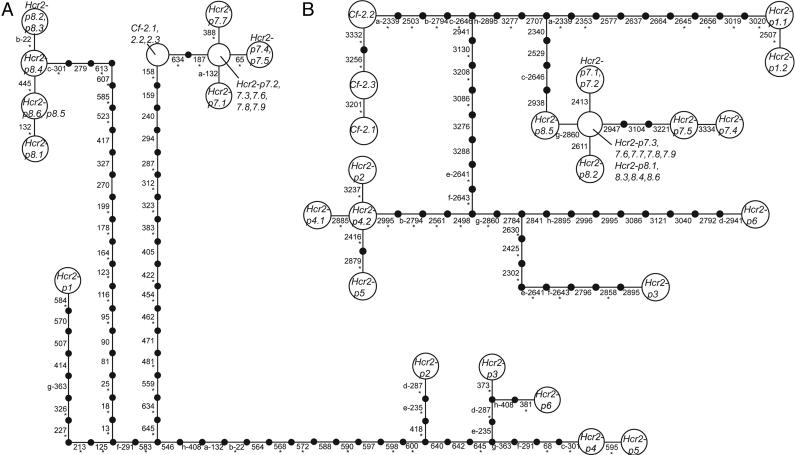
Fig. 2.
Gene networks of the alignable areas among homologs. Each step represents a mutational change between haplotypes. Connections exceeding the limits of parsimony were made based on parsimony analysis. Sites are numbered with respect to the Cf-2 size class ORF. The numbering scheme is maintained across deletions present in other haplotypes. Homoplasious mutations are marked with lowercase letters. Mutations leading to an amino acid change are marked with asterisks. Neither network is unique due to alternative placements of homoplasious mutations; alternative networks do not alter topological relationships among haplotypes. (A) Network of the first 654 bp of the 5′ portion of the genes. The limits of parsimony are 11 steps. There are 72 polymorphic sites and 76 mutations; 8 mutations are homoplasious. (B) Network of the 1,045 bp in the 3′ alignable portion of the genes. The spanned region includes the noncoding sequence for genes with early stop codons. The limits of parsimony are 14 steps. There are 55 polymorphic sites and 58 mutations; 8 mutations are homoplasious. A single 3-bp in-frame deletion occurs in size class Hcr2-p1 (position 2656–2658) and was counted as a single mutation for all analyses.

