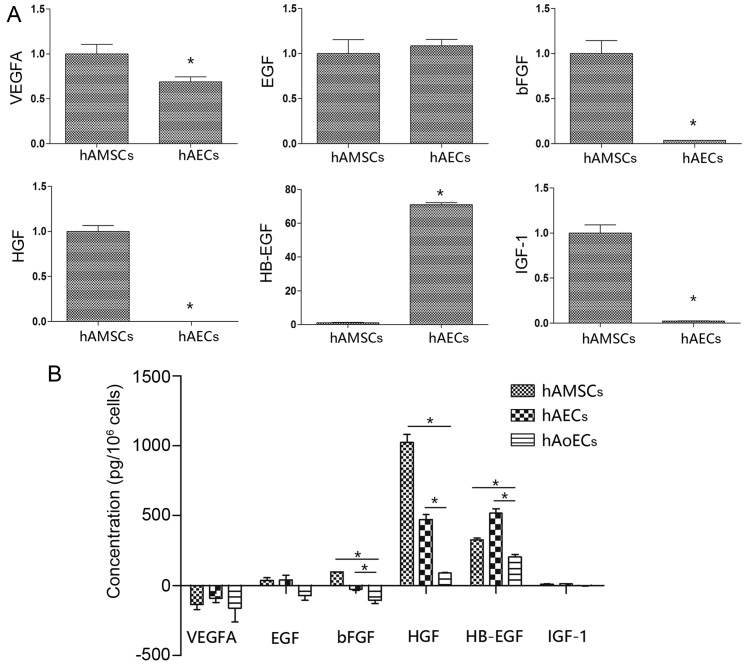
Figure 6.
Angiogenetic growth factor expression profile. (A) qRT-PCR was conducted to evaluate multiple angiogenic gene levels in hAECs and hAMSCs. All individual values were normalized to β-actin (n=3/group). *P<0.05. (B) The concentration of vascular endothelial growth factor (VEGF), epidermal growth factor (EGF), basic fibroblast growth factor (bFGF), hepatocyte growth factor (HGF), heparin binding EGF like growth factor (HB-EGF), insulin growth factor-1 (IGF-1) inconditional medium was measured by enzyme-linked immunosorbent assay (ELISA). *P<0.05. hAECs, human amniotic epithelial cells; hAMSCs, human amniotic mesenchymal stem cells.

