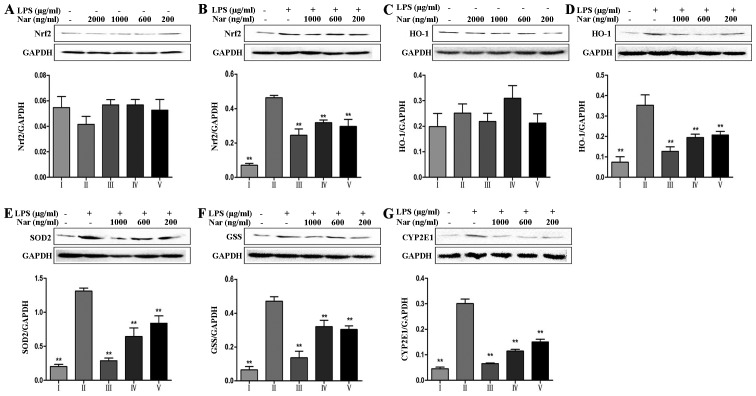
Figure 5.
Effects of naringin (Nar) on the levels of oxidative stress-related proteins. (A and B) Nuclear factor E2-related factor 2 (Nrf2), (C and D) heme oxygenase-1 (HO-1), (E) superoxide dismutase 2 (SOD2), (F) glutathione synthetase (GSS) and (G) cytochrome P450 2E1 (CYP2E1). Values are expressed as the means ± SD (n=5 treatment groups). *p<0.05 and **p<0.01 compared with the LPS group. For the bar charts: I, control; II, LPS only; III, Nar at 1,000 ng/ml; IV, Nar at 600 ng/ml; and V, Nar at 200 ng/ml.

