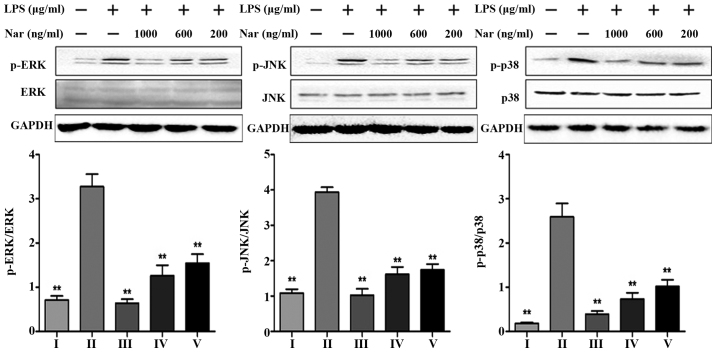
Figure 7.
Effects of naringin (Nar) on the phosphorylation levels of mitogen activated protein kinases (MAPKs). Values are expressed as the means ± SD (n=5 treatment groups). **p<0.01 compared with the LPS group. For the bar charts: I, control; II, LPS only; III, Nar at 1,000 ng/ml; IV, Nar at 600 ng/ml; and V, Nar at 200 ng/ml.

