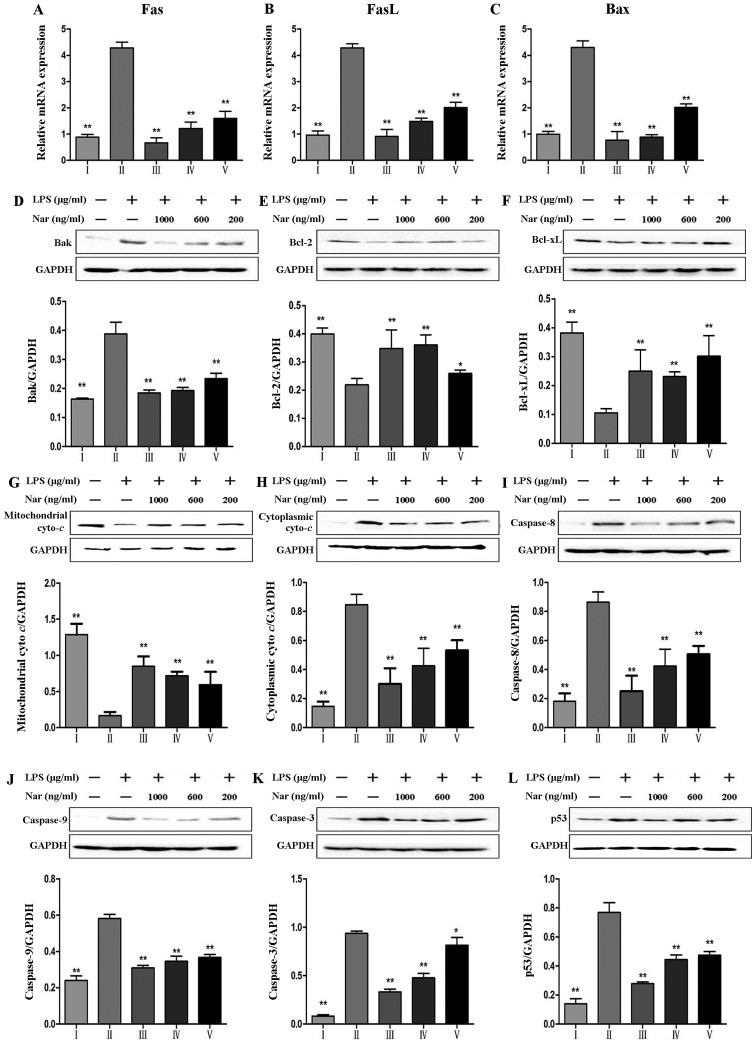
Figure 8.
Effects of naringin (Nar) on the expression of apoptosis-related genes and proteins. mRNA expression of (A) fatty acid synthase (Fas), (B) Fas ligand (FasL), (C) Bcl-2-associated X protein (Bax), and (D) protein expression of Bak, (E) Bcl-2, B-cell lymphoma 2 (Bcl-2), (F) Bcl-xL, (G) mitochondrial cytochrome c (Mito Cyto c) (H) cytoplasmic cytochrome c (Cyto Cyto c), (I) caspase-8, (J) capase-9, (K) caspase-3 and (L) p53. *p<0.05 and **p<0.05 compared with the LPS group. For the bar charts: I, control; II, LPS only; III, Nar at 1,000 ng/ml; IV, Nar at 600 ng/ml; and V, Nar at 200 ng/ml.

