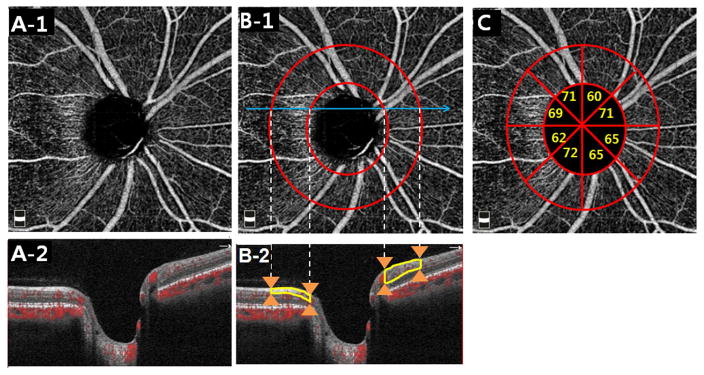
Figure 1.
Analysis of the circumpapillary retinal nerve fiber layer vessel density (cpVD) based on optic nerve head optical coherence tomography angiography images. A, Enface (A-1) and horizontal (A-2) images of the radial peripapillary capillaries within the retinal nerve fiber (RNFL) layer. B-1, Same enface image as A-1, but annotated to indicate a 750 μm-wide elliptical annulus (red circles) extending from the optic disc boundary which forms the region of analysis for cpVD and the location of the B-scan shown in B-2 (sky blue lines). B-2, B-scan view of the vessel density analysis region located within the elliptical annulus (orange arrows) and within the depth range of the RNFL layer (yellow outlines). C, Same enface image as A and B-1, but annotated to indicate for eight 45 degree sectors for cpVD.

