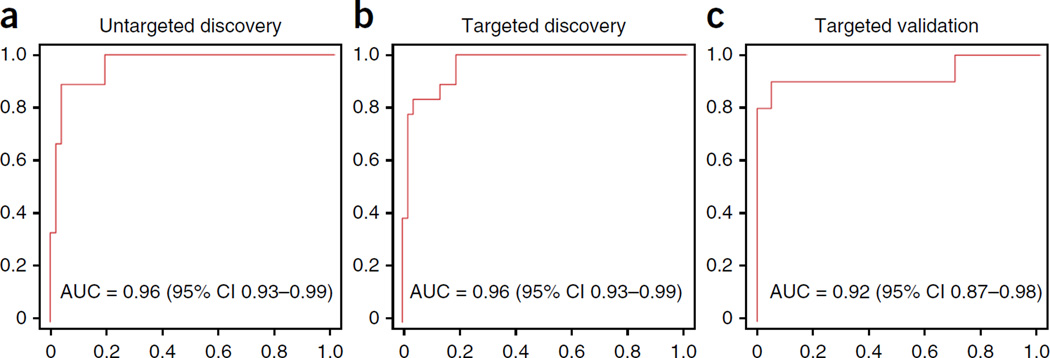
Figure 2.
ROC results for the lipidomics analyses. (a–c) Plots of ROC results from the models derived from the three phases of the lipidomics analysis. Simple logistic models using only the metabolites identified in each phase of the lipidomics analysis were developed and applied to determine the success of the models for classifying the Cpre and NC groups. The red line in each plot represents the AUC obtained from the discovery-phase LASSO analysis (a), the targeted analysis of the ten metabolites in the discovery phase (b) and the application of the ten-metabolite panel developed from the targeted discovery phase in the independent validation phase (c). The ROC plots represent sensitivity (i.e., true positive rate) versus 1 – specificity (i.e., false positive rate).

