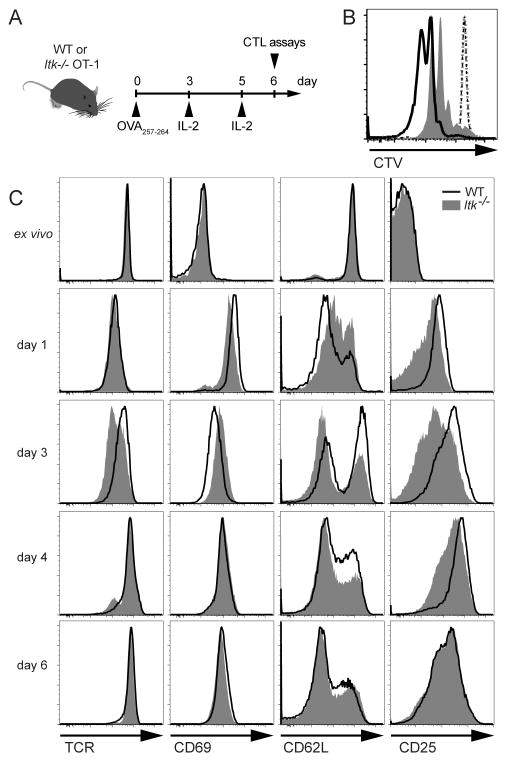
Figure 1.
ITK-deficient CTLs express similar surface marker levels after activation. (A) Schematic of in vitro activation of OT-I splenocytes. (B) Proliferation of CD8+ T cells in total ex vivo splenocytes cultures from WT or ITK-deficient OT-I mice stimulated in the presence of 10nM OVA257-264 peptide, evaluated with Cell Trace Violet (CTV). Histogram overlay depicts CTV in WT (black) or Itk−/− (grey) CD8+ T cells examined directly ex vivo (dotted lines) or after 48 hours of culture (solid). (C) Representative histograms of surface marker staining on WT (black line) or Itk−/− (grey solid) OT-I CD8+ T cells at indicated time points during in vitro activation. IL-2 was added after day 3 and day 5 of culture. Data are representative of one of greater than three independent experiments.

