
Figure 3.
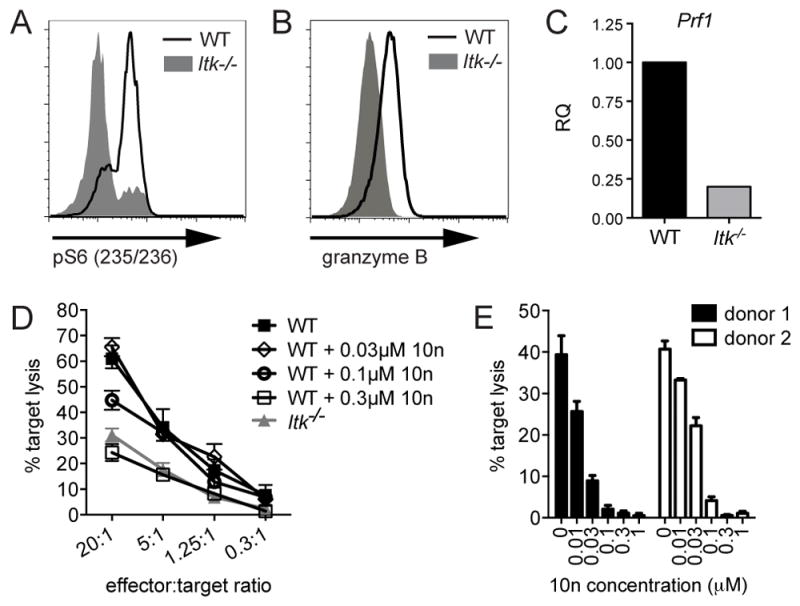
ITK-deficient CTLs show decreased expression of lytic effector molecules, and additional defects in cytolysis. (A) Whole splenocytes from WT (black line) or Itk−/− (grey solid) OT-I CD8+ T cells were activated for six hours in the presence of 10nM OVA257-264 peptide, stained and analyzed for pS6 (S235/236) using flow cytometry. Histogram is representative of three independent experiments. (B) Granzyme B expression levels measured by flow cytometry in day 7 in vitro activated WT (black) or Itk−/− (grey solid) CTLs. Histogram is representative of greater than three independent experiments. (C) Prf mRNA transcript levels in day 7 in vitro activated WT (black) or Itk−/− (grey), determined by qRT-PCR. Data are representative of two independent experiments. (D) In vitro cytolysis of EL4 targets pulsed with 1μM OVA257-264 peptide by previously activated ITK-deficient (grey triangles) or WT OTI CTLs treated with indicated concentrations of the ITK inhibitor, 10n (black open diamonds, circles, or squares) immediately before cytolysis assay, or left untreated as a control (black closed squares). Graph shows mean of triplicates ± SD, and is representative of three independent experiments. (E) In vitro cytolysis of P815 target cells pulsed with 2μg/mL OKT3 by allo-reactive human CD8+ T cells generated from two independent healthy donors and treated with 10n immediately before cytolysis assay. Graph shows mean of triplicates ± SD at 4-hour time points using 20:1 CD8:target cell ratio. Data representative of two experiments using cells from two healthy donors each.