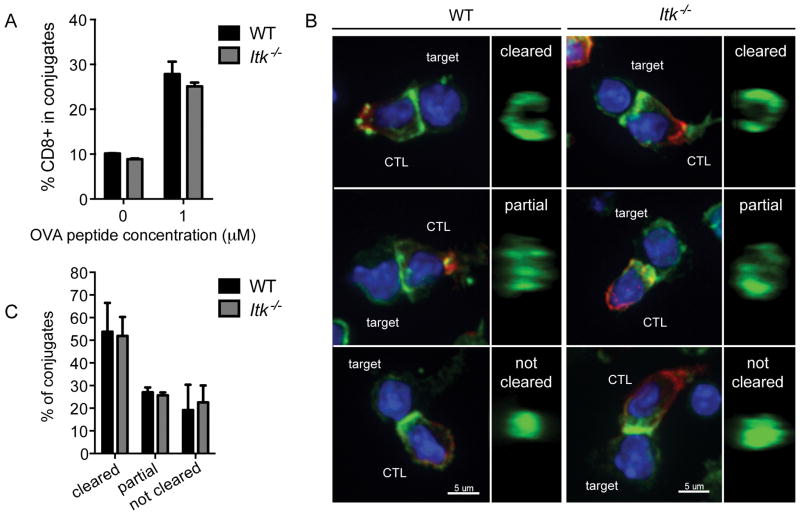
Figure 4.
Itk−/− CTLs have normal adhesion and actin ring formation during immunological synapse formation. (A) Adhesion after 20 minutes conjugation of previously activated WT (black) or Itk−/− (grey) CTLs to LPS-activated WT B cells pulsed with 1μM OVA257-264 or unpulsed B cells as a control. Graph represents mean ± SD of percent CD8+ target+ cells in total CD8+ events. Data are representative of one of greater than three experiments. (B) Representative images of maximum projections of WT or Itk−/− CTLs in conjugate pairs with LPS-activated WT B cell targets pulsed with 1μM OVA257-264 (first and third columns, respectively). 1μm slice of reconstructed z stacks rotated in the yz plane (second and fourth columns). Nuclei (blue), CD8 (red), actin (green). Scale bars = 5μm. (C) Quantification of actin ring formation at the immunological synapse between WT (black) and Itk−/− (grey) CTLs and LPS-activated WT B cell targets. Bars represent mean ± SEM from more than three independent experiments (WT total n=105, Itk−/− total n=82).

