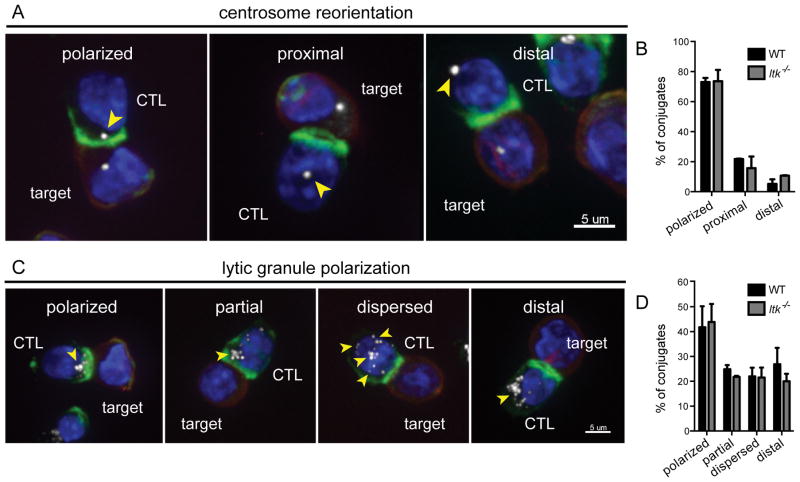
Figure 5.
Itk−/− CTLs show normal centrosome and lytic granule polarization during cytolysis of targets. (A) Centrosome reorientation shown as maximum projections. Nuclei (blue), EL4 targets (red), actin (green), γ-tubulin (white). Centrosome location highlighted by yellow arrowheads. Scale bars = 5μm. (B) Quantification of centrosome reorientation in WT (black, total n=129) and Itk−/− (grey, total n=128) CTLs. (C) Lytic granule polarization shown as maximum projections. Nuclei (blue), EL4 targets (red), actin (green), granzyme B (white). Lytic granule location highlighted by yellow arrowheads. Scale bars = 5μm. (D) Quantification of lytic granule polarization in WT (total n=127) and Itk−/− (total n=151) CTLs in conjugates with EL4 targets pulsed with 1μM OVA257-264 peptide. Bars in panels B and D represent mean ± SEM from greater than three independent experiments.

