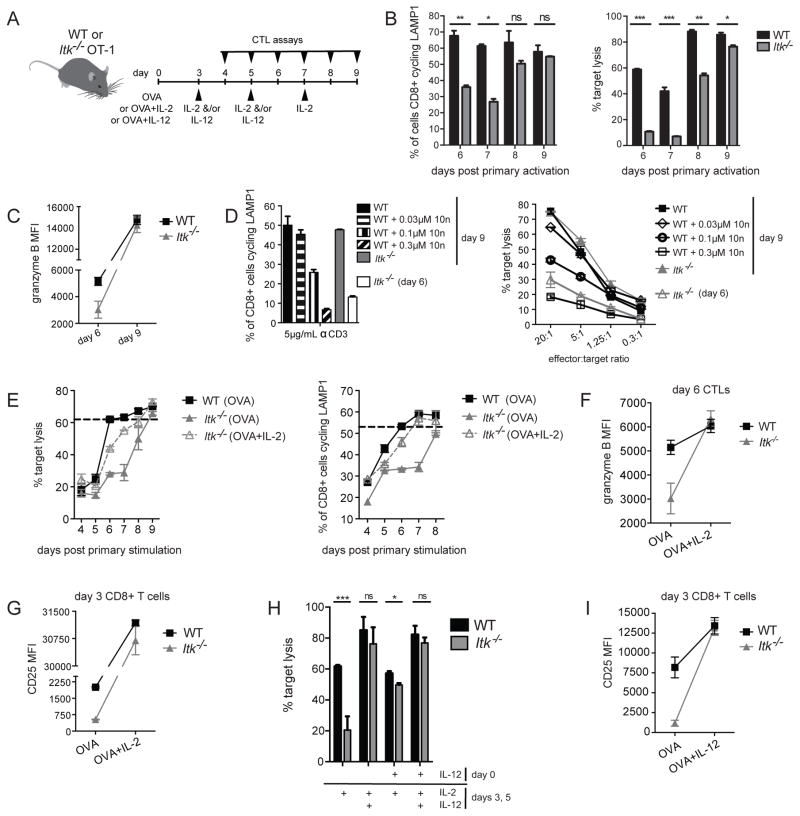
Figure 8.
Degranulation and cytotoxicity are restored in ITK-deficient CTLs after prolonged or early culture in IL-2, or the addition of exogenous IL-12 to cultures. (A) Schematic of CD8+ T cell activation and cytokine addition time course. (B) Percent of WT (black) or Itk−/− (grey) CTLs cycling LAMP1 in response to 5μg/mL of plate-bound anti-CD3 evaluated at indicated days after the start of primary activation (left panel). CD107a-PE positive cells in the CD8+ gate were determined to be positive for degranulation. In vitro cytolysis of EL4 targets pulsed with 1μM OVA257-264 peptide by WT OT-I (black) or Itk−/− OT-I (grey) CTLs at a 20:1 effector:target ratio, evaluated at indicated days after primary activation (right panel). Graphs show percent cytotoxicity ± SD at 4-hour time points and are representative of three independent experiments. *P<0.05, **P<0.01, ***P<0.001 calculated by Student’s T-test. (C) Granzyme B MFIs ± SD at indicated time points. Data are representative of two independent experiments. (D) Left panel: degranulation in day 9 CTLs in response to 5μg/mL plate-bound anti-CD3 in WT OT-I (black solid bar), WT OT-I pre-treated with the ITK inhibitor, 10n, at 0.03 μM (horizontal striped bar), 0.1 μM (vertical striped bar), or 0.3 μM (diagonal striped bar), Itk−/− OT-I CTLs (grey solid bar), or day 6 Itk−/− OT-I CTLs (open bar). Graph is representative of two independent experiments. Right panel: in vitro cytolysis of EL4 targets pulsed with 1μM OVA257-264 peptide by day 9 ITK-deficient (grey closed triangles) or WT OT-I CTLs treated with indicated concentrations of the ITK inhibitor, 10n (black open diamonds, cirlces, or squares), immediately before cytolysis assays, or left untreated as a control (black closed squares). Day 6 Itk−/− OT-I CTLs are also shown (grey open triangles). Graph shows mean of triplicates ± SD, and is representative of two independent experiments. (E) Left panel: In vitro cytolysis of 1μM OVA257-264 peptide-pulsed EL4 target cells by WT (black) or Itk−/− OT-I CTLs (grey) activated with 10nM OVA257-264 peptide and then cultured in IL-2 for three days (OVA), or Itk−/− OT-I CTLs activated with 10nM OVA257-264 peptide plus 10 IU IL-2 before continued culture in IL-2 for an additional three days (OVA+IL-2, grey open triangles). Graphs show percent cytotoxicity ± SD on indicated days and are representative of two independent experiments. Right panel: Degranulation measured in a flow-based LAMP1 cycling assay in response to plate-bound anti-CD3 in WT (black) or Itk−/− (grey) OT-I CTLs activated with 10nM OVA257-264 peptide only and then cultured in IL-2 for three days (OVA) or Itk−/− OT-I CTLs activated with 10nM OVA257-264 peptide plus 10 IU IL-2 before continued culture in IL-2 for and additional three days (OVA+IL-2, grey open triangles). Graphs show percent CD8+ T cells cycling LAMP1 ± SD, where CD107a-PE positive cells in the CD8+ gate were determined to be positive for degranulation on indicated days and are representative of two independent experiments. (F) Granzyme B MFI ± SD in day 6 WT (black) or Itk−/− (grey) OT-I CTLs activated for 3 days in the presence of 10nM OVA257-264 peptide only and then cultured in IL-2 for three days (OVA), or 10nM OVA257-264 peptide plus 10 IU IL-2 (OVA+IL-2) before continued culture in IL-2 for three days. Data are representative of two independent experiments. (G) CD25 MFIs ± SD in day 3 WT (black) or Itk−/− (grey) OT-I CD8+ T cells activated for three days in the presence of 10nM OVA257-264 peptide only (OVA) or 10nM OVA257-264 peptide plus 10 IU IL-2 (OVA+IL-2). Data are representative of two independent experiments. (H) In vitro cytolysis of EL4 targets pulsed with 1μM OVA257-264 peptide by WT OT-I (black) or Itk−/− OT-I (grey) CTLs at a 20:1 effector:target ratio, evaluated on day 6 after primary activation with 10nM OVA257-264 peptide ± exogenous IL-2 or IL-12 at indicated time points. Graphs show percent cytotoxicity ± SD at 4-hour time points and are representative of three independent experiments. *P<0.05, ***P<0.001, calculated by Student’s T-test, ns = not significant. (I) CD25 MFI ± SD in WT (black) or Itk−/− OT-I (grey) CD8+ T cells on day three after primary activation with 10nM OVA257-264 peptide only (OVA) or 10nM OVA257-264 peptide plus IL-12 (OVA+IL-12). Data are representative of two independent experiments.

