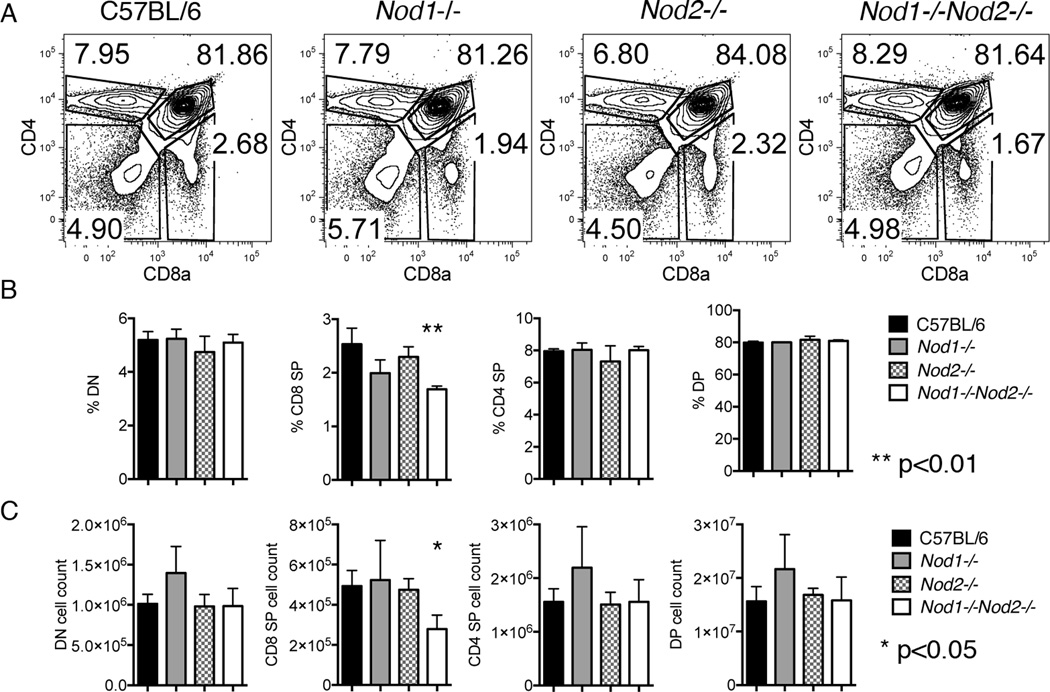
Figure 1. Thymic subset characterization of thymii from Nod1−/− Nod2−/− or Nod1−/−Nod2−/− mice.
(A) Representative flow cytometry plots from the thymus of C57BL/6 , Nod1−/−, Nod2−/−, and Nod1−/−Nod2−/−mice (labeled above) stained for CD4 and CD8a. Numbers in plots represent percentages of depicted populations. Total proportions (panel B) and numbers (panel C) of thymocyte subpopulations of C57BL/6 (black), Nod1−/−(grey), Nod2−/−(grey hatched), and Nod1−/−Nod2−/− mice (white) are shown. Bars represent mean +/− SD. Statistical analysis with paired t tests was performed. Data represent three animals per group.

