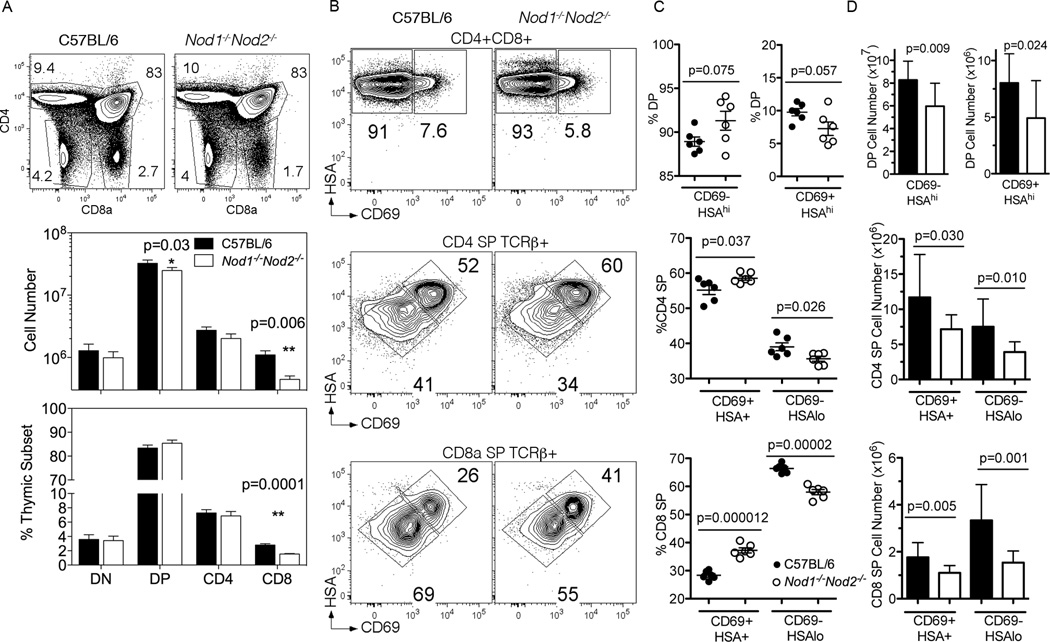
Figure 2. Thymic maturation of CD8 SP thymocytes is less efficient in the absence of Nod1 and Nod2.
(A) Representative flow cytometry plots from the thymus of C57BL/6 (left column) and Nod1−/−Nod2−/−mice (right column) stained for CD4 and CD8a. Numbers in plots represent percentages of depicted populations. Total numbers (middle panel) and proportions (lower panel) of thymocyte subpopulations of C57BL/6 (black) and Nod1−/−Nod2−/− mice (white) are shown. Bars represent mean +/− SD. Statistical analysis with paired t tests was performed. Data represent pooled results from three independent experiments with a total of 13 mice per group analyzed. (B) Representative flow cytometry plots from gated thymocyte subsets of CD4+CD8+ (DP) (top row), CD4 SP TCRβ+ (middle row) and CD8 SP TCRβ+ thymocytes (bottom row) from C57BL/6 (left column) and Nod1−/−Nod2−/−mice (right column). Total thymocytes were stained for CD4 and CD8a, and gated thymocyte populations were stained for HSA and CD69. Numbers in plot represent percentages of depicted population. Proportions (C) and numbers (D) of thymocyte subpopulations of C57BL/6 (black) and Nod1−/−Nod2−/− mice (white). Bars represent the mean +/− SD. Statistical analysis with two-tailed unpaired t tests was performed. (C) Data representative of one of two independent experiments with 6 mice per group. (D) Data represent pooled results from two independent experiments with a total of 11 mice per group.

