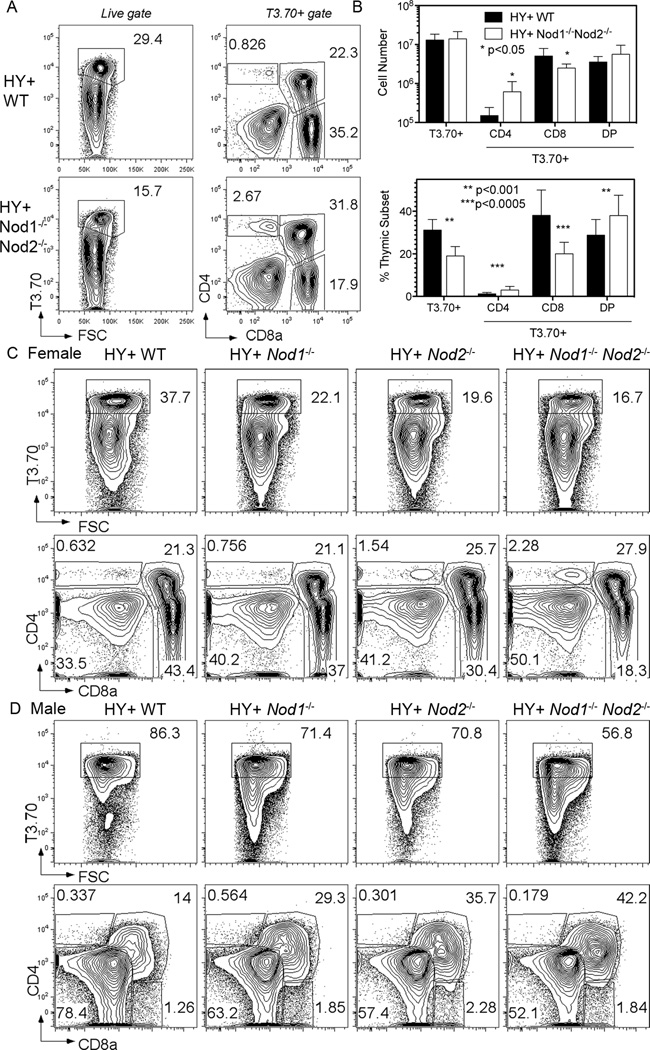
Figure 3. Both NOD genes contribute to positive and negative selection of H-Y TCR Tg thymocytes.
(A) Representative flow cytometry plots from the thymus of H-Y TCR Tg WT (top row) and H-Y TCR Tg Nod1−/−Nod2−/− (bottom row) female mice. The left column shows the percentage of thymocytes expressing the H-Y TCR (T3.70+ cells), whilst the right shows the percentages of T3.70+ thymocyte subpopulations after staining for CD4 and CD8a.
(B) Total numbers (upper graph) and proportions (lower graph) of T3.70+ cells and T3.70+ subpopulations in the thymus of H-Y TCR Tg WT (black bars) and Nod1−/−Nod2−/− (white bars) female mice. Bars represent the mean +/− SD. Statistical analysis with unpaired t tests was performed. Data represent pooled results from three independent experiments with a total of 9 mice per group analyzed.
(C and D) Representative flow cytometry plots from the thymus of H-Y TCR Tg WT (first column), Nod1−/− (second column), Nod2−/− (third column) and Nod1−/−Nod2−/− (fourth column) female (C) and male (D) mice. Upper row shows the percentage of T3.70+ thymocytes, whilst the lower row shows the percentages of T3.70+ thymocyte subpopulations after staining for CD4 and CD8a. Data are representative results of three mice per group analyzed.

