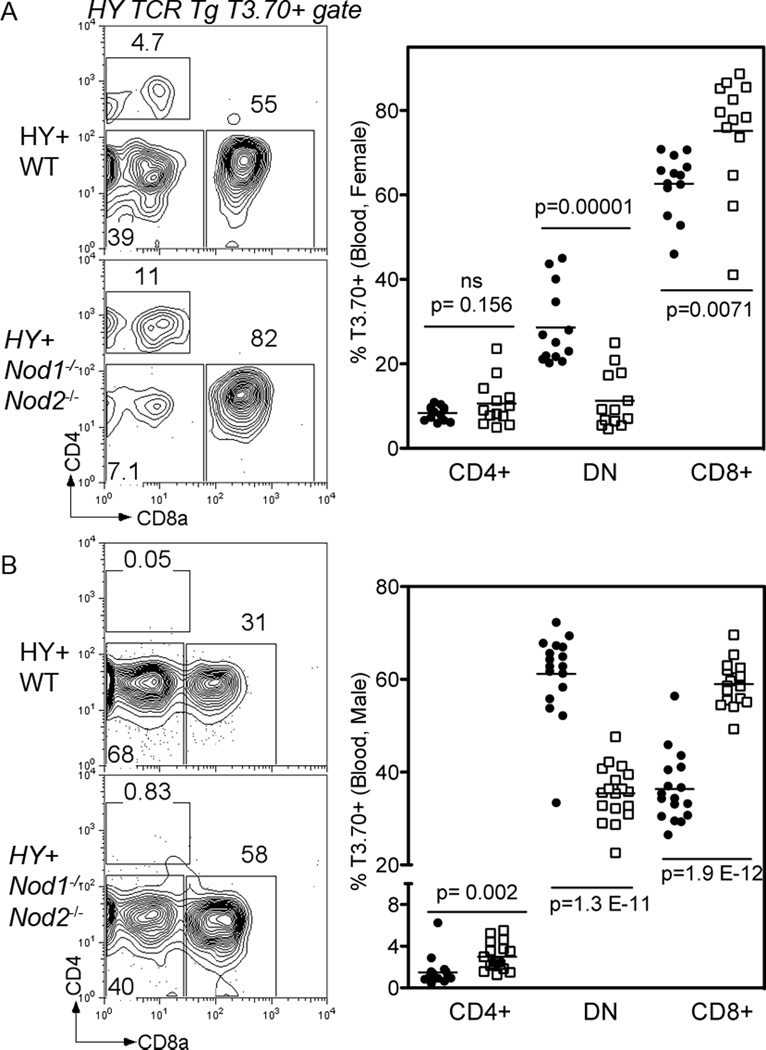
Figure 4. NOD deficiency alters lineage diversion in the H-Y TCR Tg model.
(A and B) Representative flow cytometry plots (left) from peripheral blood of H-Y TCR Tg WT (upper row and filled circles) and Nod1−/−Nod2−/− (bottom row and white squares) female (A) and male (B) mice. Right panels show the proportions of T3.70+ CD4 SP, CD4-CD8- (DN) and CD8 SP T cells in the blood. Data is pooled from multiple experiments. A total of 13 female and 17 male mice of each group were analyzed by the unpaired t test.

