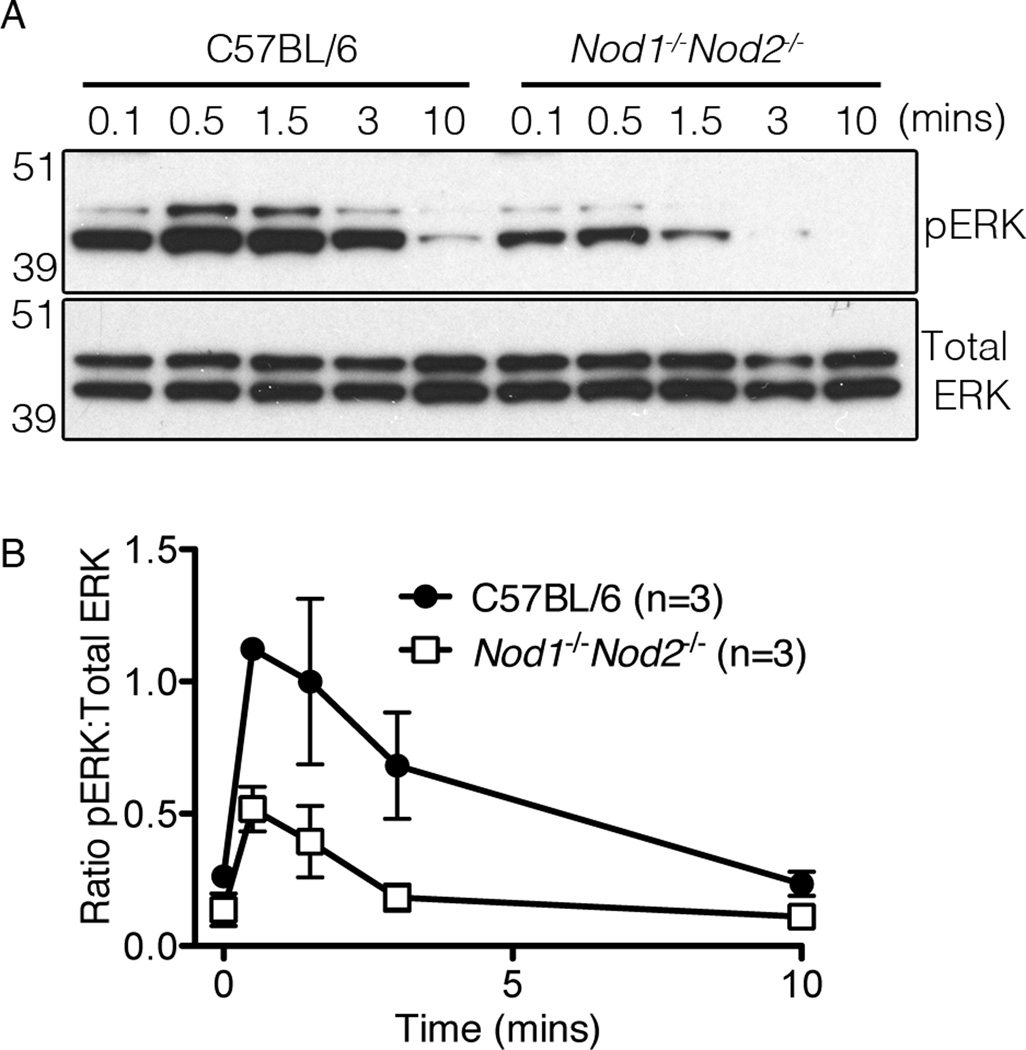
Figure 6. NOD deficiency reduces TCR-mediated ERK activation.
(A) Immunoblot analysis of phosphorylated (pERK) and total ERK1/2 in lysates of TCR-stimulated C57BL/6 (left) and Nod1−/−Nod2−/− (right) thymocytes. Thymocytes were bound with biotinylated anti-CD3 and anti-CD4 followed by stimulation with streptavidin over time. After pERK was detected, the membranes were stripped and re-probed with an antibody detecting total ERK1/2. Molecular weight standards are indicated on the left. Data are representative of three independent experiments. (B) Densitometry graph of the ratio of pERK to total ERK levels after stimulation. After measuring the densitometry of pERK to total ERK expression in the same lane/ time point over three experiments, the graph plots mean values +/− SD.

