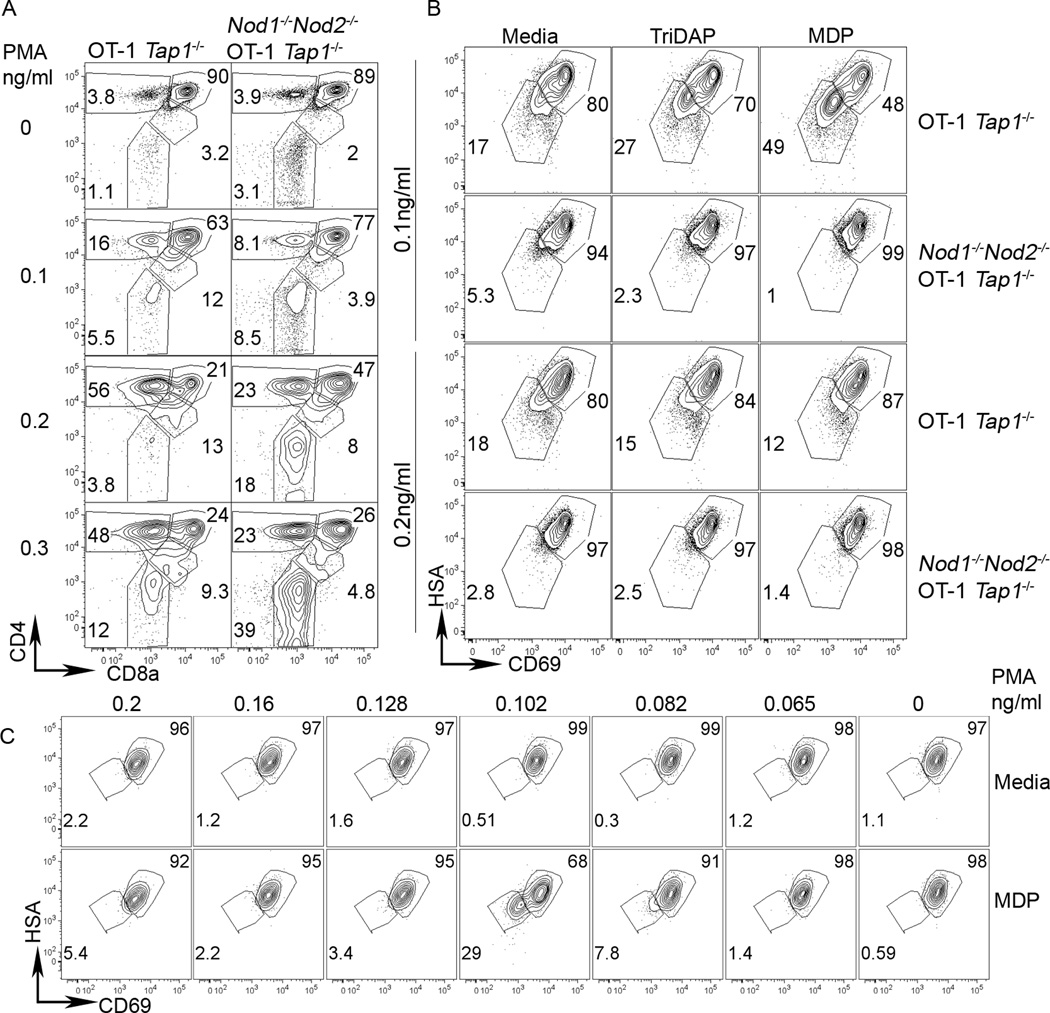
Figure 7. NOD proteins modify signal thresholds in pre-selection thymocytes.
(A) Representative flow cytometry plots from the thymus of WT OT-I TCR Tg Tap1−/− (left plots), Nod1−/−Nod2−/− OT-I TCR Tg Tap1−/− (right plots) mice stained for 7AAD, CD4 and CD8a (top row). For 15 hours, cells were stimulated with 0.2ug/ml ionomycin and a range of PMA concentrations (shown on left). After washing, cells were cultured without stimuli for a further 29 hours before analysis by flow cytometry. Numbers in plots represent percentages of depicted populations after gating on live cells (7AAD- gate). A representative of four independent experiments is shown.
NOD ligands promote maturation of thymocytes receiving selection signals. (B) Thymocytes from WT OT-I TCR Tg Tap1−/− or Nod1−/−Nod2−/− OT-I TCR Tg Tap1−/− mice were cultured as in (A) with 0.1ng/ml PMA (upper two rows) or with 0.2ng/ml PMA (lower two rows) with no ligand (left panels), 10ug/ml Tri-DAP (middle panels) or with 10ug/ml MDP (right panels). Live cells (7AAD-) were stained for HSA and CD69. (C) Titration of PMA dose (shown above) without (upper row) or with MDP (bottom row) reveals CD69 and HSA down regulation occurs when cells are cultured with the NOD2 ligand MDP specifically at 0.1ng/ml PMA.

