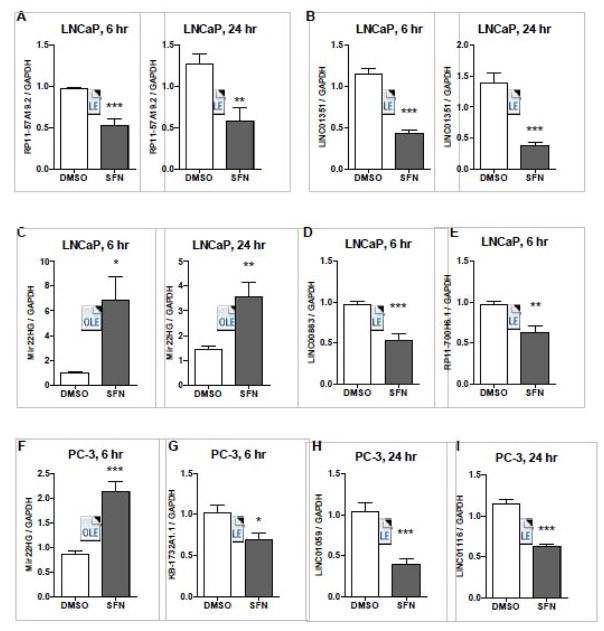
Figure 3. Validation of SFN’s capacity to normalize the expression of lncRNAs that were differentially expressed in prostate cancer cells.
LNCaP and PC-3 cells were treated with 15 μM SFN or vehicle control (DMSO) for 6 or 24 hours, and qPCR was performed. Bars are representative of the mean expression levels of the indicated lncRNA normalized to GAPDH and expressed relative to the mean expression levels in cells treated with DMSO. Samples were collected in at least triplicate, in two independent experiments (n=6–7) and stars indicates significant differences between the control and treatment groups as calculated by an unpaired, two-tailed t test where * p < 0.05, ** p < 0.01, *** p < 0.001.

