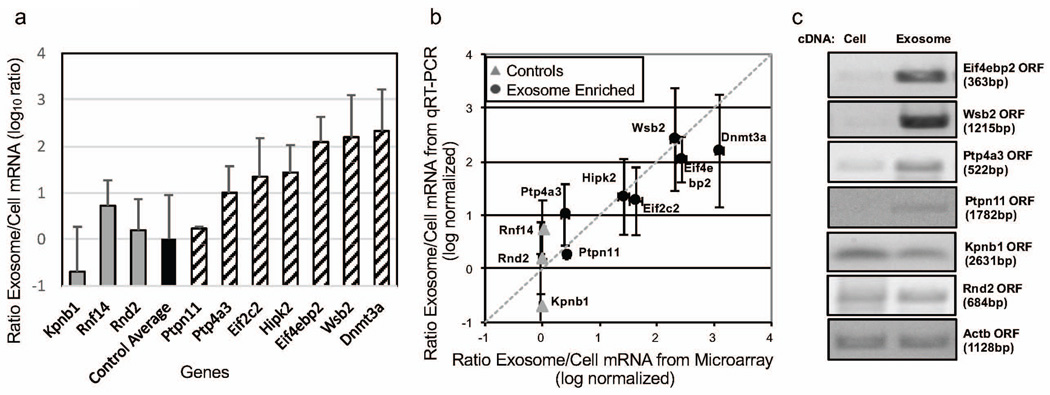
Figure 4. Relative mRNA abundance between B16F0 exosomes and cells were consistent between qRT-PCR and microarray analyses.
(a) The abundance of 10 genes (Kpnb1, Rnf14, Rnd2, Ptp4a3, Ptpn11, Eif2c2, Hipk2, Eif4ebp2, Dnmt3a, and Wsb2) in B16F0 exosomes versus B16F0 cells were quantified by quantitative RT-PCR (mean ± s.d., N = 3). The qRT-PCR results were normalized to the average differential abundance of three control genes: Kpnb1, Rnf14, and Rnd2. (b) The relative abundances of mRNAs assayed by qRT-PCR were compared against the relative abundances of mRNAs assayed by cDNA microarray. The dotted line indicates that the two different assays provide the same results for relative abundance. (c) Full-length coding sequences (ORFs) were amplified by semi-quantitative RT-PCR. Equal concentrations of RNA were reverse-transcribed into cDNA and amplified by PCR. After 25 cycles, full-length open-reading frame amplicons were monitored every three cycles and resolved on agarose gel before the amplification was saturated.

