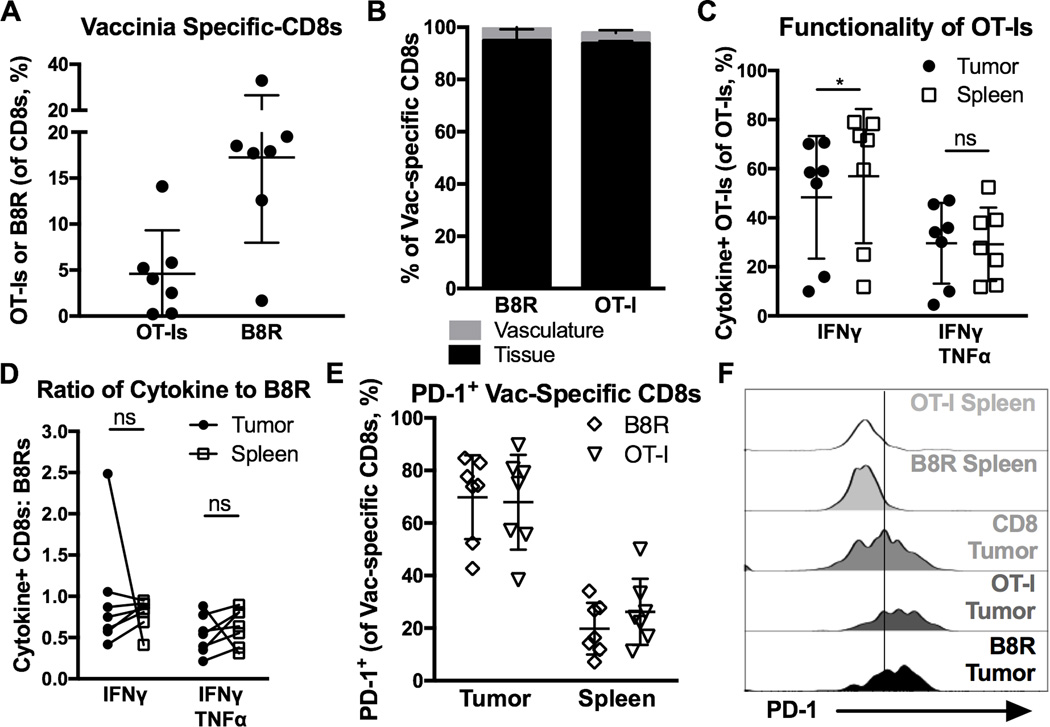
Figure 4. Vaccinia-specific CD8+ T cells become TIL after acute infection and retain function despite PD-1 expression.
Animals received 103 OT-Is on D-1, B16F0s on D0, were infected with VacV-OVA on D5, and sacrificed on D19 (n=7, 2 independent experiments) for tumor and spleen analysis. Shown is (A) the percent of Vaccinia-driven (OT-Is and B8R-specific) CD8+ T cells in the tumor, (B) the percentage of CD8α IV positive and negative Vaccinia-driven CD8+ T cells (n=4), (C) the percent of OT-Is that produced cytokine after ex vivo stimulation with peptide, (D) the functionality of VacV-driven T cells assessed as in Fig. 3B. E–F) Shown is the percent of cells that were PD-1+ (E), and the MFI of PD-1 expression (F) on total and Vaccinia-specific CD8+ T cells that were in the spleen (including CD8α IV positive and negative), and in the tumor tissue (only CD8α IV negative, n=7). All data is represented as the mean +/− SD. Significance in C and D was assessed by paired t-tests, p < 0.05 = *.

