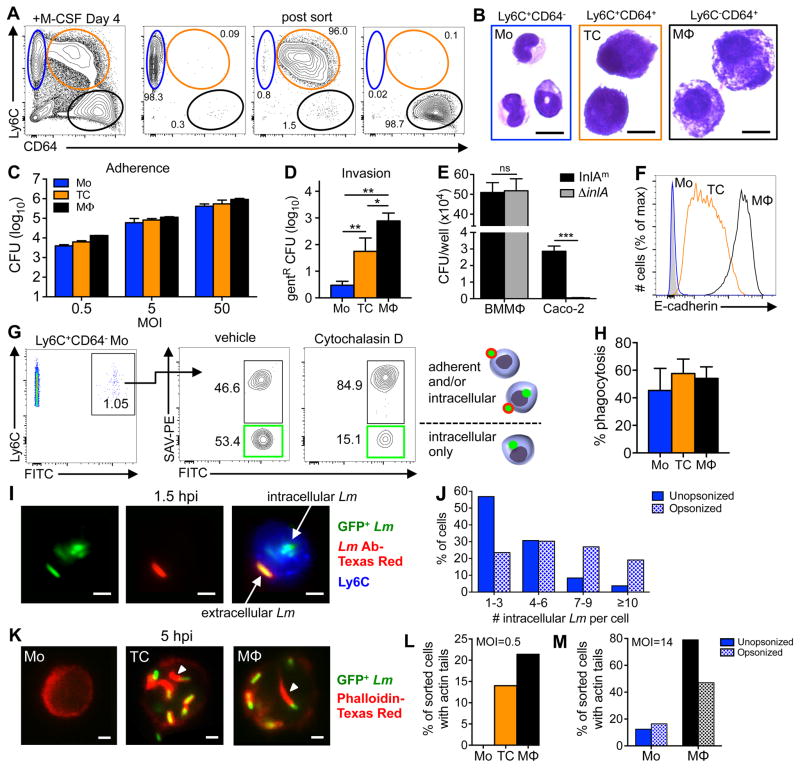
FIGURE 3.
L. monocytogenes inefficiently invade cultured CD64neg monocytes. (A) Bone marrow cultured with M-CSF for 4 days generated three CD117− populations: monocytes (blue), transitioning cells (orange), and macrophages (black). Representative dot plots indicate the average purity of each population after sorting. (B) Diff-Quik staining of sorted cells. (C) Sorted monocytes, transitioning cells, and macrophages were infected with L. monocytogenes SD2710 and the average number (±SD) of adherent CFU after washing was determined 1 hpi. (D) Total number (±SD) of intracellular (gentamicin10-resistant) L. monocytogenes SD2710 1 h after infection of sorted cells at a MOI of 0.5 (data from one of two separate experiments is shown). (E) Total number of intracellular (gent-resistant) L. monocytogenes associated with triplicate wells of either macrophages (BMMΦ) or Caco-2 cells 1 hpi. (F) E-cadherin expression on BM-derived cells 4 days after in vitro culture. (G) Control plots for phagocytosis assay. Green boxes indicate cells that internalized all associated beads. (H) Percent complete phagocytosis (FITC+PE−) for each cell type 1 h after incubation with beads. (I–J) Sorted monocytes were infected with L. monocytogenes SD2710 at a MOI of 14 for 90 min., washed 3 times, and then stained with Lm-specific antibodies. (I) Representative images of an infected monocyte show both green intracellular bacteria and yellow extracellular bacteria after merging green and red channels. (J) Number of intracellular L. monocytogenes per monocyte with or without opsonization. (K) Representative images of sorted cells infected with L. monocytogenes SD2710, fixed 5 hpi, and stained with phalloidin (red). Arrowheads indicate actin “tails”. (L) Sorted cells were infected for 5 h at low MOI (L) or high MOI with or without opsonization (M) Data from one of two separate experiments is shown; panels D & E were analyzed by two-tailed unpaired student’s t-test. Scale bars, 10 μm (B) or 2 μm (I & K).

