FIGURE 4.
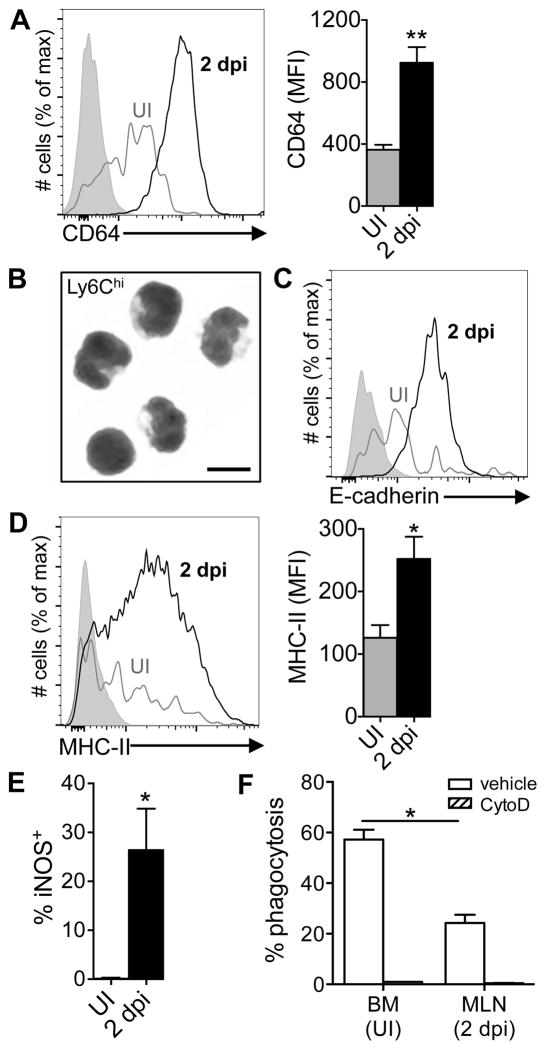
Inflammatory monocytes analyzed directly ex vivo have a partially differentiated and partially activated phenotype. Mice were fed 108 CFU of Lm SD2710 (n=6) or left uninfected (UI; n=3) and MLN were analyzed 48 h later. (A) Representative histogram and MFI (±SD) of CD64 expression on Ly6G−Ly6ChiCD11b+ monocytes. (B) Diff-Quik staining (100x) of inflammatory monocytes sorted from MLN 2 dpi; scale bar, 10 μm. (C) Representative E-cadherin expression on monocytes. (D) Representative histogram and MFI (±SD) of MHC-II expression. (E) Percentage of iNOS-producing Ly6Chi monocytes in the MLN. (F) Uptake of fluorescent beads by Ly6Chi monocytes from the bone marrow of uninfected mice or MLN of infected mice (n=6).

