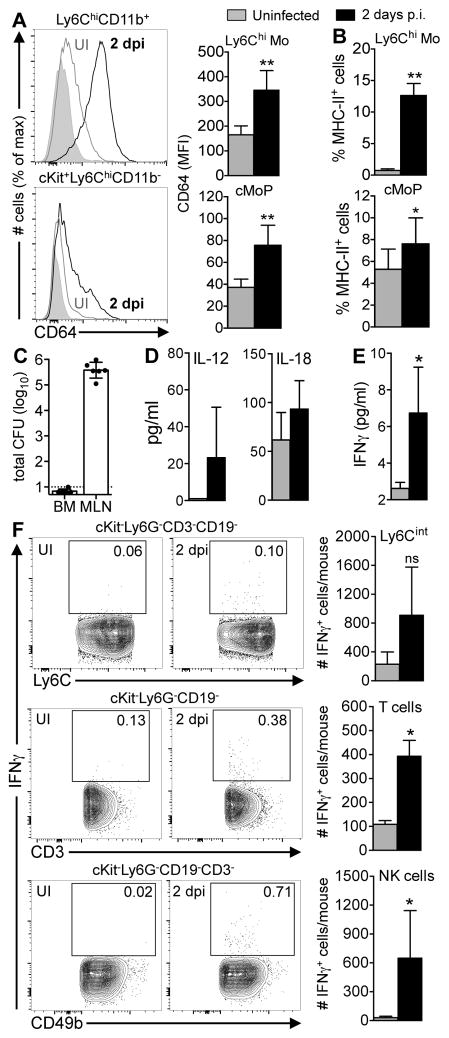
FIGURE 5.
Inflammatory monocytes are activated prior to egress from the bone marrow. Bone marrow (BM) from uninfected mice (UI; grey bars) or mice fed 108 CFU of Lm SD2710 (black bars) was analyzed 2 dpi (n=6). (A) CD64 expression on Ly6Chi monocytes (Mo) and common monocyte progenitors (cMoP) (56). (B) Mean percentage (±SD) of MHC-II+ Ly6Chi Mo and cMoP. (C) BM harvested from both femurs and tibias was plated and L. monocytogenes CFU were determined 2 dpi (n=6). (D) Mean concentration (±SD) of IL-12 and IL-18 in mouse sera (n=4). (E) Mean concentration of IFNγ (±SD) in the bone marrow without in vitro stimulation (n=4). (F) Representative contour plots of bone marrow cells showing the percentage of IFNγ+ cells. Bar graphs to the right indicate mean number (±SD) of IFNγ+ Ly6Cint, T cells, or NK cells (n=4). Two-tailed Mann-Whitney tests were used for statistical analysis.

