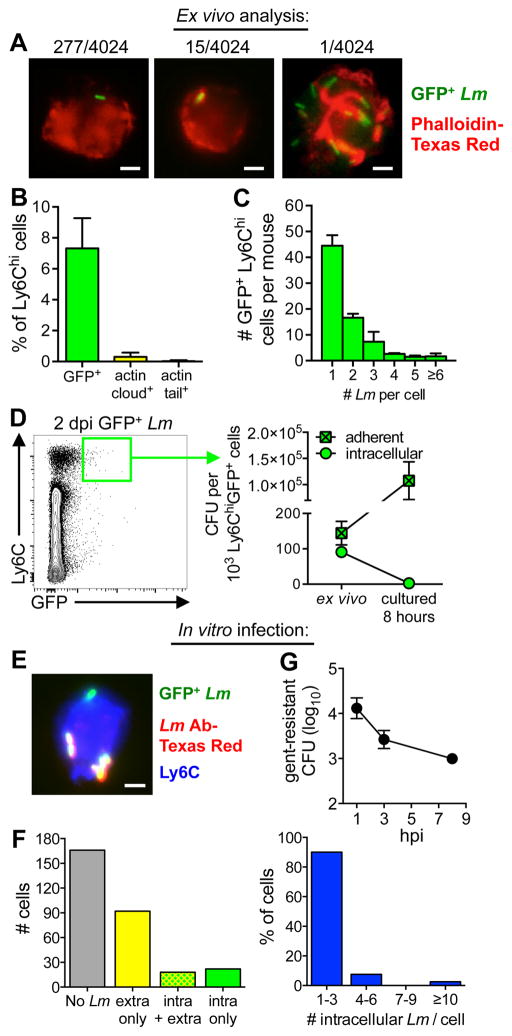
FIGURE 6.
Inflammatory monocytes do not productively support intracellular growth of L. monocytogenes. (A–C) Ly6Chi cells were sorted from the MLN 2 d after infection with Lm SD2710 and visualized directly ex vivo. (A) A total of 4,024 cells from 6 different mice (200–800 cells/mouse) were visualized. Representative images and the total number of Lm-associated (GFP+), actin cloud+ cells or actin tail+ cells observed are shown. (B) Mean percentage (±SD) of Lm-associated monocytes per mouse (n=6). (C) Average number (±SD) of L. monocytogenes per GFP+ cell. (D) GFP+ Ly6Chi cells were sorted from the MLN 2 dpi (green gate) and the mean number of adherent or intracellular (gent10-resistant) CFU (±SD) was determined directly ex vivo or after being cultured for 8 h in media with or without gentamicin. (E-F) Ly6Chi cells (1 × 10⁵/well) were sorted from the MLN 2 dpi with L. monocytogenes SD2001 and infected in vitro for 90 minutes with L. monocytogenes SD2710 at a MOI of 2. (E) Representative image for “in/out” differential staining shows a cell with both intracellular and extracellular L. monocytogenes; scale bar, 2 μm. (F) A total of 300 cells were visualized; left graph indicates the number of uninfected cells (gray bar), cells with only extracellular Lm (yellow bar), cells with both intracellular and extracellular Lm (green/yellow bar), or cells with only intracellular bacteria (green bar). Graph on the right indicates the number of intracellular L. monocytogenes observed per cell. (G) Intracellular growth assay performed on sorted GFPneg Ly6Chi cells (5 × 10⁴/well) infected in vitro for 1 h at MOI of 2.

