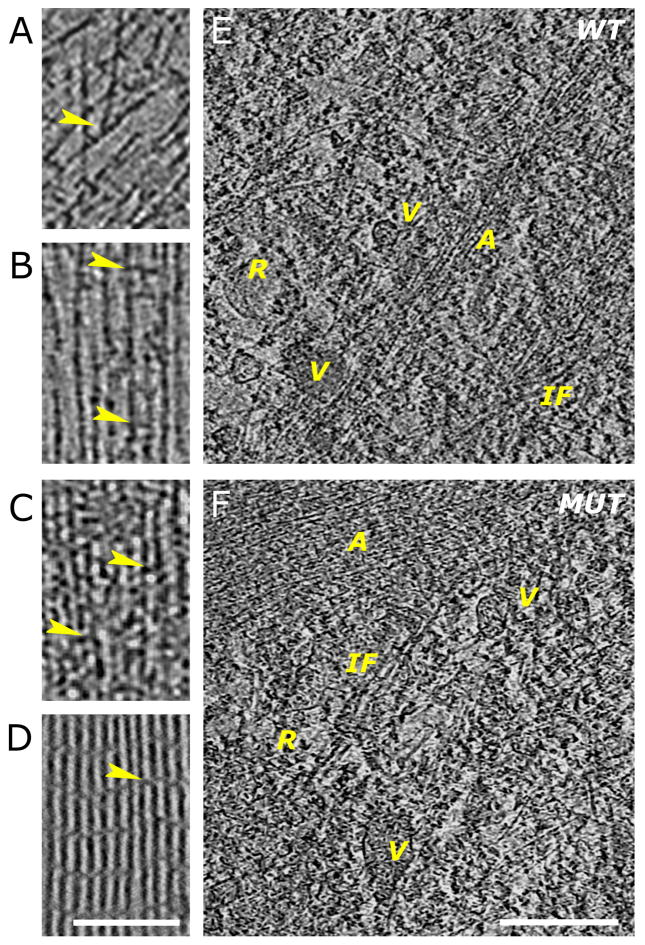
Figure 2. Comparison of features in wild-type and ARPC3−/− fibroblasts at the nanometer scale.
A–D. Examples showing 3.8-nm thick slices through three-dimensional cyro-tomograms.
A. Region near the leading edge of a wild-type cell showing actin filaments running at different angles and branch junctions (arrowhead).
B. Region in a filopodium of a wild-type cell showing parallel filaments separated by variable distances and with cross-linkers of different sizes (arrowheads).
C. Region of an FLP in an ARPC3−/− mutant fibroblast showing closely packed parallel bundles of filaments with different size cross-linkers (arrowheads).
D. Slice through a three-dimensional cryo-tomogram of a bundle of purified actin filaments cross-linked by fascin. The arrowhead points at a fascin cross-link between the actin filaments. Bar is 200 nm and applies to A–D.
E–F. Features in the Interior region of wild-type (E) and ARPC3−/− (F) fibroblasts. Various vesicular structures (V) with different content and attachements are visible. Tentative intermediate filaments (IF) and ribosomes (R) can also be identified. The actin structures visible (A) are reminiscent of those at the cell edge. They are more loosely organised in the wild-type cells. 7.6-nm slices are shown, the bar is 500 nm.

