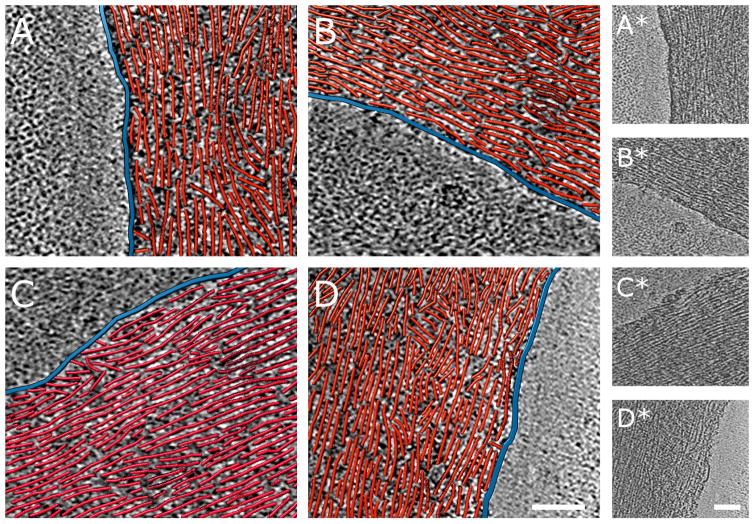
Figure 4.
Nanometer-scale characterization cell peripheries of ARPC3−/− fibroblasts. Each example shows a 3.8-nm thick slice through a three-dimensional cyro-tomogram in grayscale with a paired three-dimensional rendering of red actin filaments and blue plasma membrane traced in the boxed areas of the reconstructions. The periphery of ARPC3−/− fibroblasts shows a characteristic arrangement of actin filament bundles parallel to the edge and closely approaching the membrane. Bars are 160 nm. Raw tomogram slices of the traced regions are shown to the right.

