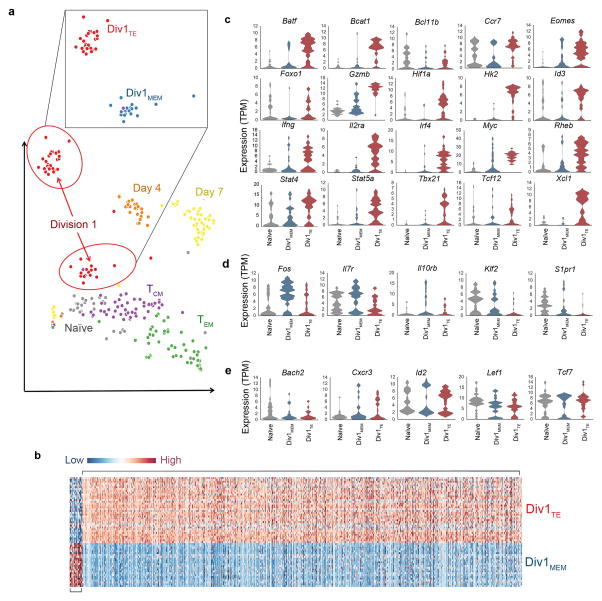
Figure 2.
Cells that have undergone their first division exhibit transcriptional heterogeneity. (a) t-distributed Stochastic Neighborhood Embedding (tSNE) of 6000 expressed genes from single CD8+ T cells from the following populations: naïve (gray), Division 1 (red), Day 4 (orange), Day 7 (yellow), central memory (TCM) (green) and effector memory (TEM) cells. Each circle represents a single cell. Inset, separation of Division 1 cells by tSNE clustering analysis into two distinct subpopulations, labeled Div1TE (red) and Div1MEM (blue) cells. TE, terminal effector; MEM, memory. (b) Differential expression of genes among Div1TE (top) and Div1MEM (bottom) cells presented as a heatmap. (c–e) Expression of selected genes previously associated with CD8+ T cell differentiation among individual naïve (gray), Div1TE (red), and Div1MEM (blue) cells, presented as violin plots, ordered alphabetically. Higher expression in Div1TE relative to Div 1MEM cells (c), lower expression in Div1TE relative to Div1MEM cells (d), or equal expression in Div1TE and Div1MEM cells (e).

